A Guide to Statistical Analysis and Its Applications
Discover the essentials of statistical analysis, outlier analysis in data mining, and data analysis. Learn key methods, tools like Python & R, and explore real-world applications in business, healthcare & more. Start your data analyst journey to become a data analyst today!
Statistical analysis is a fundamental process for making data-driven decisions in numerous fields, including business, healthcare, and social sciences. From understanding data patterns to testing hypotheses, statistical analysis helps in uncovering insights that can inform actions and strategies.
Here we will explore the core concepts of statistical analysis, delve into essential techniques, and highlight the tools and applications used in the process, with a particular focus on data mining, outlier analysis in data mining, and data analysis.
What is Statistical Analysis?
Statistical analysis involves collecting, analyzing, interpreting, and presenting data to enable informed decision-making. This powerful approach helps uncover patterns, relationships, and trends within datasets. Data Analysts analyze and interpret the data to gain meaningful insights. The process is divided into two types: descriptive and inferential statistics.
- Descriptive statistics help summarize and highlight the key characteristics of a dataset using techniques such as data visualization, central tendency measures, and dispersion metrics.
- Inferential statistics use the data from a sample to make predictions or test hypotheses about a larger population, making it essential in areas like hypothesis testing, regression analysis, and correlation.
For those who want to understand how to perform statistical analysis, grasping these methods is crucial. statistical analysis and data mining examples, such as comparing test scores, tracking sales data, or determining disease prevalence, rely on both descriptive and inferential statistics.
Essential Statistical Methods and Concepts
Understanding the primary methods and concepts in statistical analysis is the first step toward becoming proficient in this field. Below are key techniques used to process and interpret data:
Descriptive Statistics
Descriptive statistics is the initial stage of analysis. It aims to present a dataset in a clear, concise, and easily interpretable way. Key elements of descriptive statistics include:
- Measures of Central Tendency: These are metrics used to identify the center of a data distribution. The most common measures are:
- Mean: The average of all data points.
- Median: The middle value when data is ordered.
- Mode: Mode is the value that appears most often in a dataset.
- Measures of Dispersion: These metrics describe the spread of data points. Key measures include:
- Range: Range is the difference between the highest and lowest values in the given dataset.
- Variance: The average squared deviation from the mean.
- Standard Deviation: It is the measure of how spread out the values are in the given dataset.
- Data Visualization: Data visualization techniques used by the data analyst, such as histograms, bar charts, and pie charts, to represent data graphically. The visual representation help analysts quickly grasp trends and outliers.
Inferential Statistics and Modeling
Inferential statistics goes beyond the description of data, allowing analysts to make predictions and test hypotheses. Common inferential techniques include:
- Hypothesis Testing: This technique is used to evaluate assumptions or claims about a population using data from a sample. For example, in medical research, analysts may assess whether a new therapy produces a meaningful impact on patient recovery outcomes.
- Regression and correlation are used to explore relationships of one variable with the other. Linear regression helps in modeling how a dependent variable changes in response to one or more independent variables, while correlation quantifies the strength and direction of the association between two variables.
- Other Techniques: More complex methods, such as multivariate analysis, factor analysis, and outlier analysis in data mining, are used for analyzing high-dimensional data and detecting anomalies.
Read the articles below:
- What’s Next for Data Analysts? Predictive and Prescriptive Analytics
- Data Analytics in the Age of Big Data & Machine Learning
- Top 5 Emerging Trends in Data Analytics for 2025
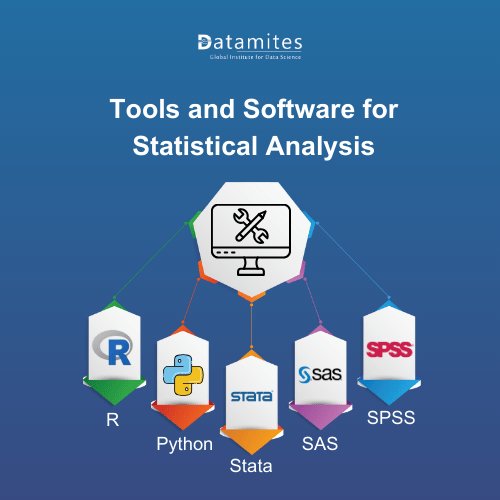
Common Tools and Software for statistical analysis and data mining
To conduct effective data analysis, analysts depend on statistical tools and software. The selection of these tools varies based on the analysis complexity, the data involved, and the specific industry. Below are some of the most popular tools used by data analyst for statistical analysis:
1. R Programming for Data Analysis
R is a free, open-source programming language and environment specifically designed for statistical computing and data visualization. Commonly used across industries, it excels in managing large datasets, performing advanced statistical analyses, and generating detailed visual representations of data. While R is often used alongside tools like Python, it stands out for its strong statistical modeling capabilities.
2. Python for Data Analysis
Python is a versatile programming language that has become a go-to for data analysts. Python offers powerful capabilities for statistical analysis and data mining, with data manipulation through libraries such as Pandas, NumPy, and SciPy. It is especially useful for data mining and cleaning, making it ideal for statistical analysis examples involving large datasets.
3. Stata
Stata is a software package used for data management, statistical analysis, and graphics. It is commonly used in economics, political science, and social research for its ability to perform advanced statistical tests and create visual representations of data.
4. SAS
SAS (Statistical Analysis System) is a robust analytics software designed to support predictive analytics, and statistical data analysis. It is widely used in top industries hiring data analyst such as finance, healthcare, and retail for large-scale data analysis and reporting.
5. SPSS
SPSS (Statistical Package for the Social Sciences) is an easy-to-use software designed for statistical analysis in social science research. It is particularly useful for non-technical users who need to perform standard statistical tests, such as t-tests, ANOVAs, and regression analysis.
Other statistical tools for data analysis, such as Excel, Tableau, and MATLAB, are also widely used for statistical analysis and data mining, depending on the user's needs and expertise. These statistical tools for data analyst provide different features that can aid in conducting basic statistical tests, visualizing data, and performing more complex computations.
Applications of Statistical Analysis Across Fields
Statistical analysis plays a critical role in multiple fields by helping professionals make informed decisions based on data. Below are some notable applications:
1. Business and Market Research
In business, statistical analysis is used to understand consumer behavior, forecast sales trends, and improve marketing strategies. Data mining techniques help businesses uncover hidden patterns in customer data, allowing them to make targeted marketing decisions. Outlier analysis in data mining helps detect anomalies in sales or customer behavior, which could indicate fraud or operational issues.
Deloitte reports that manufacturers who have begun adopting industrial metaverse initiatives have seen a 12% improvement in key metrics, including sales efficiency, product quality, throughput, and labor productivity.
2. Healthcare and Clinical Studies
Analysts use hypothesis testing to assess the effectiveness of new treatments, while regression analysis can help predict patient outcomes based on various factors. In clinical trials, statistical data analysis ensures that the results are valid and significant.
3. Environmental Science and Sustainability
In environmental science, statistical analysis helps monitor climate change, assess pollution levels, and model ecosystem dynamics. Techniques like regression analysis and multivariate analysis are used to analyze complex environmental data and forecast future trends.
4. Public Policy and Government
Governments use statistical analysis to make data-driven policy decisions. By analyzing census data, statistical methods can identify demographic trends, economic conditions, and social issues. This allows policymakers to allocate resources effectively and design better public programs.
5. Sports, Technology, and Scientific Research
In sports, statistical analysis helps optimize player performance, predict game outcomes, and improve team strategies. In scientific research, data mining techniques are used to uncover patterns in large datasets, driving innovation in fields such as genetics, physics, and astronomy.
Step-by-Step Guide to the Statistical Analysis Process
Performing statistical analysis involves several key steps that ensure accuracy and validity. Here is a step-by-step guide:
1. Planning and Defining Objectives
Before beginning any analysis, it is important to define the research questions and objectives. Are you testing a hypothesis or making predictions? Defining clear objectives will guide your entire analysis process.
2. Data Collection Techniques
Collecting the useful data is essential for meaningful statistical analysis. Data can be obtained through various methods, including surveys, experiments, or observational studies. Ensure that the data collected is reliable and represents the population you're studying.
3. Data Cleaning and Exploratory Analysis
Data cleaning is crucial before any statistical techniques are applied. This step involves removing outliers, handling missing values, and correcting errors. Exploratory data analysis (EDA) helps you understand the data's underlying patterns and detect any issues that need to be addressed.
4. Applying Statistical Methods
Once the data is ready, apply the appropriate statistical methods. For example, use descriptive statistics to summarize data, regression analysis for modeling relationships, and hypothesis testing for validating assumptions.
5. Interpreting and Communicating Results
After applying statistical methods, interpret the results in the context of your research objectives. Communicate the findings clearly, using visual aids like charts and graphs to support your conclusions.
Statistical analysis is a powerful tool for uncovering insights and driving decisions in various fields, from business to healthcare. Mastering statistical data analysis techniques such as data mining, outlier analysis in data mining, and regression analysis can enhance your ability to interpret complex data. By utilizing the right statistical tools for data analyst, understanding core methods, and applying statistical analysis in relevant applications, data analyst can unlock valuable information that leads to more informed decisions.
Research by Statista shows that retailers using AI and machine learning-based analytics see a 5–6% boost in sales and profit growth compared to those that haven't adopted these technologies.
To learn more about statistical analysis, data mining, and how to apply these techniques, explore our tutorials, courses, and resources. Start your journey into the world of data analysis today!
Refer to the articles:
- Top IT Courses in Pune
- Top IT Courses in Mumbai
- Top IT Courses in Chennai
- Top IT Courses in Bangalore
Joining a Data Analyst course in Bangalore or other major tech hubs such as Chennai, Pune, Hyderabad, Ahmedabad, Coimbatore, Delhi, Jaipur, and Mumbai offers rich hands-on industry exposure, excellent networking prospects, and accelerated career development.
If you're aiming to build a successful career in data analytics, choosing the right institute is the first crucial step—and DataMites Institute stands out as the best in the industry. Offering top IT courses like Data Analyst, Data Science, Machine Learning, Python Programming, and Artificial Intelligence, DataMites blends job-oriented curriculum with live training, making learning practical and future-ready.
What sets DataMites apart is its flexible online classes, offline training, and hands-on internship designed to simulate real-world challenges. Learners benefit from working on real-time projects, gaining industry exposure through internships, and receiving dedicated mentor support. Each course is certified by IABAC and NASSCOM Futureskills, ensuring industry recognition.
DataMites also offers Data Analyst course , perfect for those seeking interactive, mentor-led classroom experiences. With strong placement support, DataMites is truly the bridge between education and employment.
DataMites Institute offers Data Analyst courses in Hyderabad but also in major cities like Pune, Hyderabad, Bangalore, Ahmedabad, Jaipur, Coimbatore, Delhi, and Mumbai—providing flexible and accessible learning options for aspiring professionals across India.