How to Use Statistical Methods in Data Analytics
In today’s data-driven environment, businesses depend on data for informed decision-making and gaining a competitive edge. However, raw data must be processed using statistical methods to extract meaningful insights. Statistical techniques play a crucial role in data analytics, revealing patterns and trends across various industries such as finance, healthcare, and marketing. In this blog, we will examine the key statistical methods used in analytics, their implementation, and the challenges analysts encounter. Whether you are contemplating a Data Analytics course or aiming for a career in this field, grasping these methods is essential for success.
Understanding Statistical Methods
Before diving into how statistical methods are used in data analytics, it’s essential to understand what these methods entail. Statistical methods involve collecting, analyzing, interpreting, and presenting data to make decisions based on patterns and trends.
Statistical methods can be broadly categorized into two main types:
- Descriptive Statistics: These methods summarize and describe data features using measures such as mean, median, mode, and standard deviation. They offer an overall view of the dataset without making predictions or inferences.
- Inferential Statistics: These methods involve making predictions or generalizations about a population based on a sample. Inferential techniques include hypothesis testing, regression analysis, and confidence intervals.
In a Data Analytics certification course, these foundational concepts are covered in detail, giving learners the tools to apply statistics to real-world scenarios.
Key Statistical Techniques in Data Analytics
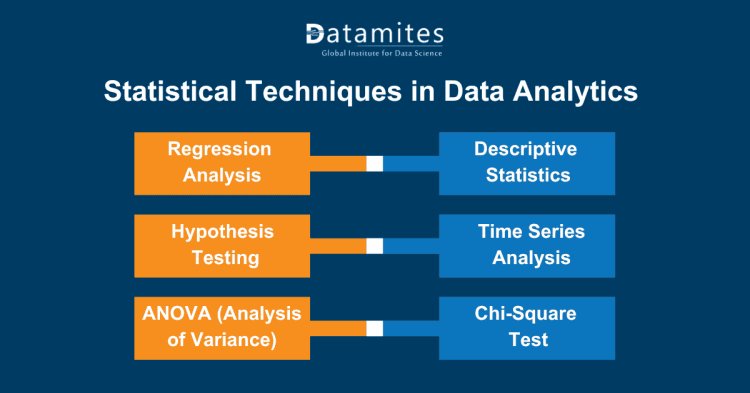
Statistical techniques are vital in data analytics, enabling analysts to derive meaningful insights from data. Here are some of the key statistical techniques commonly used in the field:
1. Regression Analysis
Regression analysis is a statistical method used to understand relationships between variables and make predictions.
- Linear Regression: This technique analyzes the relationship between two variables by fitting a linear equation to observed data. It's useful for predicting a dependent variable based on one or more independent variables.
- Multiple Regression: This extends linear regression by using multiple independent variables to predict a single dependent variable, allowing for more complex relationships to be modeled.
2. Hypothesis Testing
Hypothesis testing is a technique for drawing conclusions about a population using data from a sample.
- Null Hypothesis (H0): A statement claiming that there is no impact or distinction.
- Alternative Hypothesis (H1): The statement that there is an effect or difference.
This technique helps analysts determine the statistical significance of their findings, guiding data-driven decision-making.
3. ANOVA (Analysis of Variance)
ANOVA is used to compare the means of three or more groups to see if at least one group differs significantly from the others.
- One-Way ANOVA: Examines how a single factor influences a dependent variable.
- Two-Way ANOVA: Assesses the impact of two factors simultaneously, allowing for interaction effects to be evaluated.
ANOVA is valuable in experimental design and quality control.
4. Descriptive Statistics
Descriptive statistics provide a summary and highlight the characteristics of a dataset, offering a quick overview of its features.
- Measures of Central Tendency: Mean, median, and mode represent the dataset's center.
- Measures of Dispersion: Range, variance, and standard deviation illustrate how data is distributed or spread out.
These statistics help analysts understand the overall characteristics of their data before further analysis.
5. Time Series Analysis
Time series analysis involves examining data points collected over time to identify trends and patterns.
- Moving Averages: Used to reduce short-term variations and emphasize long-term trends.
- ARIMA Models: AutoRegressive Integrated Moving Average models are used for forecasting future values based on past observations.
Time series analysis is particularly useful in finance and sales forecasting.
6. Chi-Square Test
The Chi-Square test is utilized to assess whether there is a significant relationship between categorical variables.
- Chi-Square Test of Independence: Assesses whether two categorical variables are independent.
- Chi-Square Goodness of Fit Test: Determines if a sample distribution matches a theoretical distribution.
This test is commonly used in survey analysis and market research.
Understanding these key statistical techniques is essential for anyone involved in data analytics. Mastery of these methods enables analysts to extract valuable insights, support decision-making, and drive business strategies. Whether you're pursuing a Data Analytics course or advancing in your career in Data Analytics, these techniques will play a crucial role in your success.
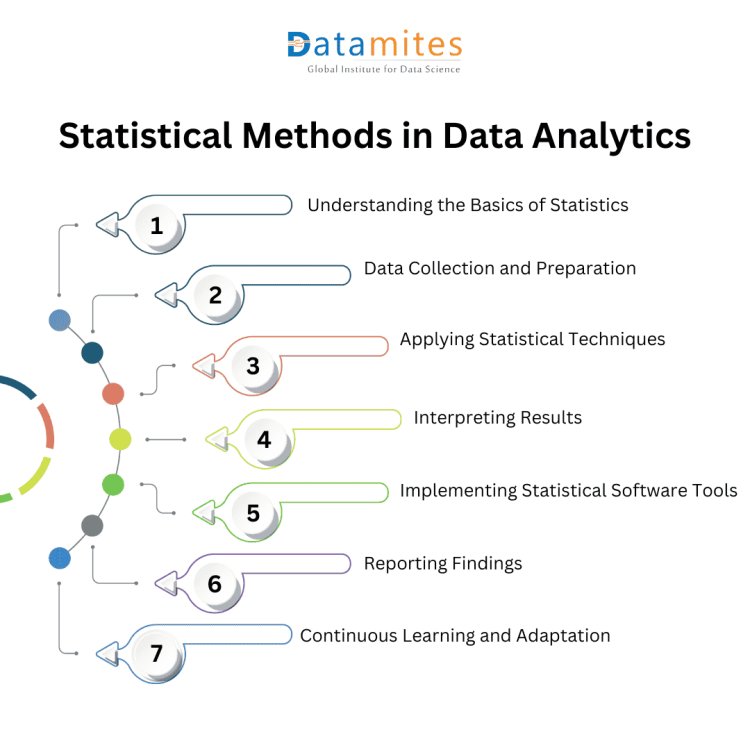
Implementing Statistical Methods in Data Analytics
Implementing statistical methods in data analytics involves applying various statistical techniques to analyze and interpret data effectively. Here’s a comprehensive outline of how this can be accomplished:
1. Understanding the Basics of Statistics
Descriptive Statistics: Provide an overview and description of the key characteristics of a dataset. Common metrics include:
- Mean, median, and mode (central tendency)
- Variance and standard deviation (dispersion)
- Percentiles and quartiles
Inferential Statistics: Make predictions or draw conclusions about a population using data from a sample. This includes:
- Hypothesis testing
- Confidence intervals
- Regression analysis
2. Data Collection and Preparation
- Data Gathering: Collect data from various sources, ensuring it's relevant and sufficient for analysis.
- Data Cleaning: Prepare data for analysis by handling missing values, removing duplicates, and correcting inconsistencies.
- Data Transformation: Convert data into a suitable format for analysis, including normalization and encoding categorical variables.
3. Applying Statistical Techniques
Exploratory Data Analysis (EDA): Use visual and quantitative methods to explore data distributions and relationships.
- Visualizations: Histograms, box plots, scatter plots, and heatmaps.
- Summary Statistics: Calculate means, variances, and correlations.
Hypothesis Testing: Formulate and test hypotheses using techniques such as t-tests, chi-square tests, and ANOVA to determine if observed patterns are statistically significant.
Regression Analysis: Model relationships between variables:
- Linear Regression for predicting a continuous outcome based on one or more predictor variables.
- Logistic Regression for binary outcomes.
Time Series Analysis: Analyze data points collected or recorded at specific time intervals to identify trends, seasonal patterns, and cyclic behaviors.
4. Interpreting Results
- Analyze the outcomes of statistical tests to draw meaningful conclusions.
- Assess the significance of the results, including p-values and confidence intervals.
- Visualize findings using charts and graphs to communicate insights clearly.
5. Implementing Statistical Software Tools
- Utilize software tools such as R, Python (with libraries like Pandas, NumPy, SciPy, and StatsModels), SAS, or SPSS for statistical analysis.
- Write scripts or use built-in functions to perform statistical tests and analyses.
6. Reporting Findings
- Prepare reports or dashboards summarizing key insights, methodologies used, and implications for decision-making.
- Utilize visual aids to improve understanding and support discussions with stakeholders.
7. Continuous Learning and Adaptation
- Stay updated with advancements in statistical methods and analytics technologies.
- Continuously refine techniques based on feedback and new data to improve accuracy and relevance.
By following these steps, one can effectively implement statistical methods in data analytics, providing valuable insights that can drive informed decision-making and strategic initiatives.
Challenges in Using Statistical Methods
Although statistical methods offer powerful tools for data analysis, there are common challenges that data analysts often face. Addressing these challenges is essential for producing accurate and reliable results.
Common Pitfalls
- Overfitting: Overfitting happens when a model becomes overly complex and matches the training data too closely, which reduces its ability to generalize well to new data.
- Data Bias: If the dataset used is not representative of the population, the results may be skewed, leading to inaccurate conclusions.
Strategies to Overcome Challenges
- Cross-Validation: Use cross-validation techniques to assess how well a model performs on unseen data, minimizing the risk of overfitting.
- Balanced Datasets: Ensure your data is representative of the larger population to avoid bias and obtain accurate insights.
Many of these challenges and solutions are addressed during a Data Analytics training in Bangalore, where learners are taught how to troubleshoot and optimize their analyses.
Future Trends in Statistical Analysis
As technology continues to evolve, so do the statistical methods used in data analytics. The following trends are shaping the future of data analysis, making it an exciting field for those considering a career in Data Analytics.
1. Machine Learning Integration
Machine learning algorithms are increasingly being integrated with statistical methods to create more powerful models. These algorithms can process vast amounts of data and identify patterns that traditional statistical methods might miss.
- Automated machine learning (AutoML) for faster analysis.
- Deep learning for complex, non-linear relationships.
2. Big Data and Cloud Computing
The rise of big data has increased the need for advanced statistical techniques that can handle large datasets. Cloud computing platforms provide scalable options for processing and analyzing large datasets.
- Real-time analytics for immediate insights.
- Scalable infrastructure for handling massive datasets.
Statistical methods are vital for data analytics, turning data into actionable insights. Mastering these techniques is essential for anyone pursuing a career in this field, and training at a top Data Analytics training provides a solid foundation for success. As the industry evolves, skills in regression, hypothesis testing, and machine learning will remain crucial. Enrolling in a Data Analytics certification course can enhance your skills and provide the practical experience needed to excel in this dynamic area.
DataMites Institute is a prominent provider of professional training in data science and analytics. Their extensive Data Analytics Course aims to equip learners with crucial skills for interpreting and analyzing data. In collaboration with respected organizations such as IABAC and NASSCOM FutureSkills, DataMites offers industry-recognized certifications. The institute also features a wide range of courses, including Artificial Intelligence, Data Science, Machine Learning, and Python Programming. Each program is carefully designed to align with the evolving needs of the tech industry, enhancing both career opportunities and technical expertise.

