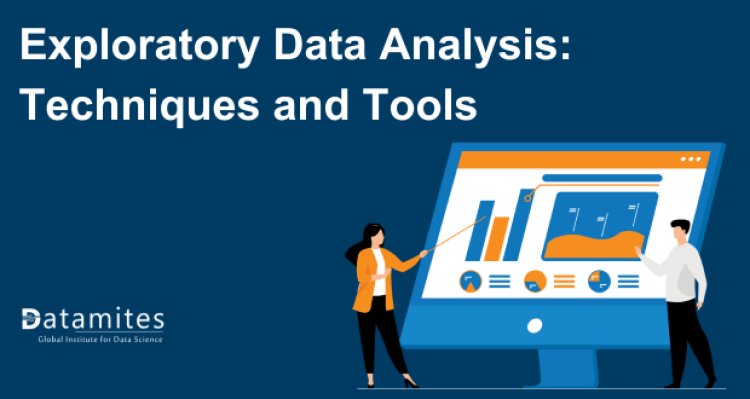
Exploratory Data Analysis: Techniques and Tools
In today's data-driven world, organizations collect vast amounts of data to gain insights, make informed decisions, and drive strategic initiatives. According to a report by IBM, 90% of the data in the world today has been created in the last two years alone. This staggering statistic underscores the importance of effectively analyzing this data to extract meaningful information. This is precisely where Exploratory Data Analysis (EDA) proves invaluable.
Exploratory Data Analysis (EDA) is an essential phase in the data analysis workflow where the primary features of a dataset are summarized, frequently through visual techniques. By leveraging EDA, data analysts can uncover patterns, spot anomalies, and frame hypotheses that guide further analysis. In this blog post, we will delve into the techniques and tools used in EDA, providing you with a comprehensive guide to mastering this essential skill. Whether you are enrolled in a data analytics course or pursuing data analytics training, this post will equip you with the knowledge to perform EDA effectively.
What is Exploratory Data Analysis?
Exploratory Data Analysis (EDA) is the process of analyzing data sets to summarize their main characteristics, often using visual techniques. It is the first step in the data analysis process, where analysts explore the data to discover patterns, spot anomalies, test hypotheses, and check assumptions with the help of summary statistics and graphical representations.
The main objectives of EDA are:
- Understanding Data Structure: Identifying the type of data and the relationships between different variables.
- Detecting Outliers: Finding unusual data points that can affect the results of the analysis.
- Uncovering Patterns: Discovering trends, correlations, and other hidden structures within the data.
Refer these articles:
- Data Analytics Lifecycle: From Data Collection to Insights
- Introduction to Data Analytics: Key Concepts and Applications
- Descriptive Vs Predictive Vs Prescriptive Analytics
The Significance of Exploratory Data Analysis in Data Analytics
Exploratory Data Analysis is a foundational skill in data analytics. It equips analysts with the ability to make sense of large and complex data sets, guiding them towards the most relevant and impactful insights. Whether you are undertaking a data analytics training course or engaged in data analytics certification training, mastering EDA is essential for becoming a proficient data analyst. EDA enables you to:
Develop a Deep Understanding of Data:
- Data Distribution: EDA helps you understand how data is distributed across different variables. You can identify patterns, trends, and anomalies by visualizing distributions using histograms, box plots, and density plots.
- Relationships and Correlations: By examining scatter plots and correlation matrices, you can uncover relationships between variables. This can guide feature selection and engineering, as well as inform modeling strategies.
Improve Analysis Accuracy:
- Data Quality: EDA allows you to detect and address issues such as missing values, outliers, and inconsistencies. Cleaning and preprocessing data is essential for ensuring that subsequent analyses and models are built on a solid foundation.
- Assumptions Testing: Many statistical models and analyses rely on specific assumptions (e.g., normality, linearity). EDA helps test these assumptions and adjust methodologies as needed to ensure that the results are valid and reliable.
Enhance Communication:
- Visualizations: Effective visualizations created during EDA (like bar charts, heatmaps, and time series plots) can make complex data more understandable. They provide a clear and intuitive way to present findings, making it easier to convey insights to non-technical stakeholders.
- Storytelling: EDA helps in constructing a narrative around the data. By identifying key insights and trends, you can craft a compelling story that highlights the significance of your findings and supports decision-making processes.
Guide Further Analysis:
- Hypothesis Generation: EDA often reveals interesting patterns or anomalies that can form the basis for more formal hypotheses and targeted analyses.
- Model Selection: Insights gained from EDA can inform the choice of statistical or machine learning models. For instance, if EDA reveals non-linearity, you might consider non-linear models or transformations.
Informed Decision-Making:
- Prioritization: By understanding which variables are most influential or which trends are most significant, you can prioritize areas of focus for deeper analysis.
- Risk Management: EDA helps identify potential risks and uncertainties in the data, allowing you to address these issues before they impact decision-making.
Refer these articles:
- What is Datamites Certified Data Analyst Certification
- What is Certified Data Scientist Course
- What Is AI Engineer Course
Key Techniques in Exploratory Data Analysis
Exploratory Data Analysis (EDA) is a crucial step in the data analysis process, aimed at understanding the underlying patterns, relationships, and anomalies in a dataset. Here are some fundamental methods employed in Exploratory Data Analysis (EDA):
Data Collection and Preparation
The first step in EDA is gathering relevant data and preparing it for analysis. This involves:
- Data Cleaning: Handling missing values, correcting inconsistencies, and removing duplicates to ensure data quality.
- Data Transformation: Converting data into a suitable format for analysis, such as normalizing or standardizing variables.
Descriptive Statistics
Descriptive statistics summarize and provide information about the main features of a data set. Key measures include:
- Central Tendency: Mean, median, and mode give insights into the typical values in the data.
- Variability: Standard deviation and variance indicate the spread of data points around the mean.
Data Visualization
Visualizing data is crucial for identifying patterns and gaining insights. Common visualization techniques include:
- Histograms: Show the spread or allocation of values for one variable.
- Scatter Plots: Show relationships between two variables.
- Box Plots: Highlight the spread and detect outliers in the data.
- Bar Charts: Compare categorical data.
Dimensionality Reduction
Dimensionality reduction streamlines data by decreasing the number of variables. Methods such as Principal Component Analysis (PCA) are employed to:
- Simplify Data: Reduce the complexity of data sets while retaining essential information.
- Enhance Visualization: Make high-dimensional data easier to visualize and interpret.
Outlier Detection
Outliers can skew analysis results, so identifying them is critical. Techniques include:
- Z-scores: Determine how many standard deviations away a data point is from the average.
- IQR Method: Identify outliers by measuring the interquartile range.
Correlation Analysis
Understanding relationships between variables is essential in EDA. Correlation analysis involves:
- Correlation Coefficients: Measure the strength and direction of relationships between variables.
- Correlation Matrices and Heatmaps: Visual tools to display correlation coefficients among multiple variables.
Tools for Exploratory Data Analysis
Exploratory Data Analysis (EDA) involves summarizing and visualizing data to understand its underlying patterns and structures. Here are some commonly used tools and techniques for EDA:
Python Libraries
Python offers powerful libraries for EDA:
- Pandas: Essential for data manipulation and analysis.
- Matplotlib and Seaborn: Create static, animated, and interactive visualizations.
- NumPy: Perform numerical operations efficiently.
- Scikit-learn: Provide tools for machine learning preprocessing and dimensionality reduction.
R Packages
R is another popular language for data analysis with robust EDA packages:
- ggplot2: A versatile package for data visualization.
- dplyr: Simplifies data manipulation tasks.
- tidyr: Helps in data tidying, ensuring data sets are in a consistent format.
Data Visualization Tools
Specialized tools for interactive and business-focused visualizations include:
- Tableau: Renowned for its dynamic and engaging data visualization features.
- Power BI: Combines business analytics with powerful visualization features.
Read these articles:
Best Practices in Exploratory Data Analysis
Exploratory Data Analysis (EDA) plays a crucial role in the data science process. It focuses on uncovering and summarizing the fundamental features of a dataset, frequently employing visual techniques to gain insights. The goal is to understand the data better, detect patterns, spot anomalies, test hypotheses, and check assumptions. Here are some best practices to follow during EDA:
1. Iterative Process
EDA should be an iterative process, involving multiple cycles to refine insights and achieve a thorough understanding of the data. Each iteration should build upon previous findings, revealing deeper patterns and relationships. This iterative nature ensures that the analysis is comprehensive and nuanced, allowing for continuous refinement and discovery.
2. Combining Domain Knowledge
Integrating domain knowledge with EDA is essential for meaningful and accurate analysis. Understanding the context and nuances of the data helps in interpreting results correctly and drawing relevant conclusions. Domain expertise can guide the selection of appropriate methods and tools, ensuring that the analysis is grounded in the specific characteristics and requirements of the data field.
3. Comprehensive Documentation
Detailed documentation of the Exploratory Data Analysis (EDA) process is essential for ensuring reproducibility and fostering effective collaboration. Detailed records of the steps taken, tools used, and insights gained ensure that the analysis can be reviewed, validated, and extended by others. Good documentation practices support transparency and facilitate teamwork, making it easier for colleagues to understand and build on your work.
4. Visual Exploration
Utilize visual methods extensively to explore the data. Graphs, plots, and charts can reveal trends, correlations, and outliers that may not be apparent in numerical summaries. Tools like histograms, scatter plots, box plots, and heatmaps are invaluable for visualizing different aspects of the data and gaining intuitive insights.
5. Handling Missing Data
Address missing data carefully by identifying, quantifying, and dealing with it appropriately. Strategies include imputation, exclusion, or using algorithms that handle missing values. Understanding the nature and pattern of missing data is crucial for making informed decisions about how to manage it.
6. Automation and Tools
Leverage automation tools and libraries to streamline the EDA process. Tools like pandas, seaborn, matplotlib, and automated EDA libraries can speed up the analysis, allowing for more focus on interpretation and insight generation.
Exploratory Data Analysis is a fundamental skill in data analytics that enables analysts to understand, clean, and visualize data effectively. By mastering EDA techniques and tools, you can uncover valuable insights and make informed decisions. Whether you are pursuing a data analytics course or engaging in data analytics training, the ability to perform EDA will greatly enhance your analytical capabilities. Start applying these techniques in your own projects and share your experiences to contribute to the ever-evolving field of data science.
Exploratory Data Analysis (EDA) is a crucial step in the data science workflow, allowing professionals to uncover insights and patterns that drive informed decision-making. For those looking to deepen their expertise in this field, DataMites Institute stands out as a leading educational resource. Accredited by IABAC and NASSCOM FutureSKills, DataMites offers a comprehensive suite of courses, including Data Analytics courses, Data Science Course, Artificial Intelligence Course, and Machine Learning Course. These programs are crafted to provide individuals with the expertise and insights necessary to thrive in the fast-paced realm of data science and analytics. Whether you're a beginner or a seasoned professional, DataMites provides the tools and training to help you advance your career and harness the power of data effectively.