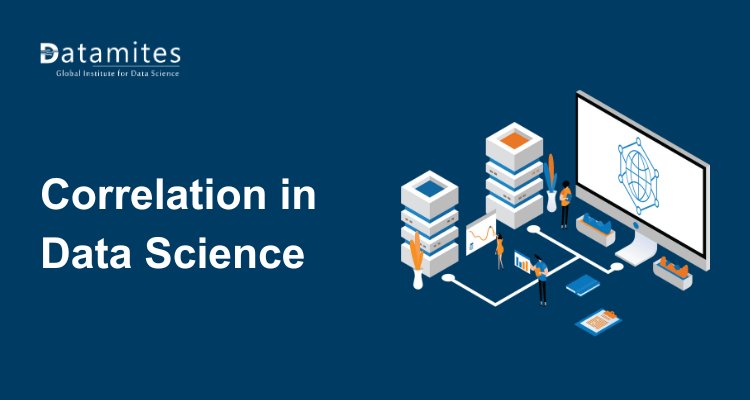
What Is Correlation in Data Science? Importance, and Real-World Examples
Correlation in data science measures how strongly two variables move together. It helps reveal patterns, predict outcomes, and guide decisions in areas like finance, healthcare, and marketing.
Understanding how different factors influence each other is a key skill in data science. Correlation analysis reveals connections between variables for example, how temperature impacts ice cream sales or how study time affects exam performance. It helps determine whether data points move together or in opposite directions.
For aspiring data scientists, mastering correlation is vital for predictive modeling, feature selection, and statistical analysis. From healthcare to finance and marketing, knowing how to interpret correlations empowers professionals to make smarter, data-driven decisions, making it an essential skill for anyone exploring the scope of data science.
What Is Correlation in Data Science?
In data science and statistics, correlation refers to the degree to which two variables are related. It measures how changes in one variable correspond to changes in another. For example, when people exercise more (variable X), their body fat percentage (variable Y) might decrease indicating a negative correlation.
The correlation coefficient is a numerical value that quantifies this relationship. It ranges from –1 to +1:
- +1 means a perfect positive correlation
- –1 means a perfect negative correlation
- 0 means no correlation
However, it’s important to note that correlation does not imply causation. Two variables may move together due to coincidence or because of a third factor influencing both. For example, ice cream sales and drowning incidents both increase during summer but one does not cause the other. Recognizing this distinction is critical in data analytics and machine learning.
Importance of Correlation in Data Science
Correlation plays a central role in almost every stage of the data science process from data exploration to model development and business decision-making.
Here’s why correlation analysis is so important:
1. Feature Selection and Dimensionality Reduction
In machine learning, too many features can make models complex and less accurate. Correlation helps identify redundant variables features that carry similar information. By removing highly correlated features, we improve model performance and training efficiency.
2. Data Preprocessing and Understanding Patterns
Before building predictive models, data scientists perform exploratory data analysis (EDA). Correlation helps detect meaningful patterns, relationships, and dependencies in data a key step in data visualization and statistical analysis.
3. Improving Predictive Models
Knowing which features correlate strongly with target variables enhances predictive modeling. For instance, identifying a strong correlation between customer engagement and purchase likelihood can refine recommendation systems.
4. Business Value and Decision Optimization
In real-world applications, understanding correlation helps businesses make informed decisions from forecasting sales to optimizing marketing strategies. It supports data-driven decision-making, which is vital for companies leveraging the future of data science.
Refer to these articles:
- A Beginner’s Guide to Bagging in Data Science
- How Data Science Uses Cluster Analysis for Customer Segmentation
- Top Databases Every Data Scientist Should Know in 2025
Types of Correlation
Correlation can take various forms, depending on the direction and strength of relationships between variables.
1. Positive Correlation
A positive correlation occurs when two variables move in the same direction as one increases, the other also increases.
Example:
- As temperature rises, ice cream sales increase.
- As years of experience increase, salary often increases.
In correlation analysis, this is represented by a positive correlation coefficient (e.g., +0.8), showing a strong direct relationship. Positive correlations are widely used in predictive modeling, such as estimating revenue growth based on marketing expenditure.
2. Negative Correlation
A negative correlation means that as one variable increases, the other decreases.
Example:
- As the price of a product goes up, its demand tends to go down.
- As exercise frequency increases, body fat percentage decreases.
In correlation in data science, negative correlations are valuable for detecting inverse relationships, often useful in data-driven business strategies and machine learning models for forecasting.
3. Zero Correlation
Sometimes, there’s no meaningful relationship between two variables this is called zero correlation.
Example:
- A person’s shoe size and their favorite movie genre.
- The number of letters in your name and your monthly income.
Zero correlation suggests that the two variables move independently. Recognizing this helps data scientists filter out irrelevant features during feature selection a critical step in improving model accuracy.
Understanding these types of correlation in data science helps professionals choose the right method for accurate analysis across datasets.
How to Calculate Correlation
The Pearson correlation coefficient is calculated using the formula:
r = Σ(xᵢ - x̄)(yᵢ - ȳ) / √[Σ(xᵢ - x̄)² * Σ(yᵢ - ȳ)²]
Where:
xᵢ, yᵢ → individual data points
x̄, ȳ → mean values of each variable
Interpretation:
r = +1 → Perfect positive correlation
r = -1 → Perfect negative correlation
r = 0 → No correlation
In practice, data scientists use tools like Python, R, and Excel to calculate correlation efficiently.
Visualization of Correlation
Visualizing correlation makes complex relationships easier to understand. The most common methods include:
- Scatter Plots: Show how two variables move in relation to each other.
- Heatmaps: Display correlation matrices using color intensity for quick insights.
- Pair Plots: Combine multiple scatter plots to show relationships across features.
For instance, using Seaborn’s heatmap() function, analysts can easily identify highly correlated variables during data visualization or EDA. These data science tools are an essential part of modern data science training, helping learners build analytical intuition.
Refer to these articles:
- Why Cloud Computing Skills Are Important for Data Scientists
- Essential Math for Data Science
- Introduction to Spark: A Key Module in Advanced Data Science
Real-World Examples of Correlation in Data Science
Correlation analysis is widely used across industries. Let’s explore some correlation examples in real life to understand its applications.
1. Healthcare: Cholesterol vs Heart Disease Risk
Medical researchers analyze the correlation between cholesterol levels and the likelihood of heart disease. A positive correlation often indicates that higher cholesterol increases cardiovascular risk helping in predictive diagnosis and preventive care.
2. E-commerce: Product Ratings vs Sales Volume
In online shopping, higher-rated products usually sell more. Identifying this correlation helps businesses prioritize customer satisfaction and improve their recommendation algorithms.
3. Finance: Inflation vs Interest Rate
Economists study the correlation between inflation and interest rates to predict market stability. Understanding this relationship supports investment strategies and financial planning.
4. Marketing: Ad Spend vs Revenue
Companies analyze how advertising budget correlates with revenue growth. A strong positive correlation confirms that marketing efforts are paying off, guiding future campaign strategies.
5. Education: Study Hours vs Exam Scores
Educators use correlation analysis to measure how study habits affect student performance. This insight helps improve teaching methods and academic programs.
These real-world examples show how correlation analysis drives insights, optimizes strategies, and informs decision-making across diverse fields, making it a crucial skill for anyone pursuing a career in Data Science.
Refer to these articles:
Correlation and the Future of Data Science
As data science trends evolve, correlation remains a vital skill. Understanding data correlation helps analysts build stronger models, detect anomalies, and uncover patterns in large datasets. For professionals looking to master these skills, enrolling in a data science course in India can provide hands-on training in Python, Pandas, and Seaborn, equipping them to excel in AI, deep learning, and big data analytics while driving predictive modeling and decision automation.
The field’s growth is impressive: according to The Business Research Company, the global data science platform market is projected to grow from $153.71 billion in 2025 to $476.36 billion by 2029, at a CAGR of 32.7%. This highlights the expanding scope of data science and the value of mastering skills like correlation analysis, feature selection, and data visualization for anyone pursuing a career in data science.
To sum up, correlation in data science is a powerful statistical tool that helps uncover meaningful relationships between variables. From improving predictive modeling accuracy to guiding smarter business decisions, correlation lies at the heart of modern data analytics.
If you’re passionate about exploring data relationships and starting a career in data science, now is the time to strengthen your data science skills. Enroll in an offline data science course to gain hands-on experience with correlation analysis, data visualization, and feature selection essential skills to Become a Data Scientist in today’s competitive world.
Step into the world of Data Science and discover how understanding correlation in Data Science helps turn raw data into meaningful insights. Correlation analysis allows you to see how variables are related, identify trends, and make informed, data-driven decisions across industries. Enrolling in a Data Science course in Chennai, Delhi, Bangalore, Hyderabad, Pune, Coimbatore, Ahmedabad, or Mumbai can provide practical skills, hands-on project experience, and the analytical knowledge essential for anyone looking to excel in today’s data-centric world.
One institute making a mark is DataMites Training Institute. DataMites’ industry-focused curriculum emphasizes experiential learning, giving students exposure to real-world challenges through live projects and practical examples. The DataMites Certified Data Scientist courses, accredited by IABAC and NASSCOM FutureSkills, cover key topics such as Data Science, data visualization, machine learning, Python programming, Data Engineering, and Artificial Intelligence, preparing students with in-demand skills for diverse industries.
DataMites offers Data Science training in Chennai, Bangalore, Hyderabad, Pune, Coimbatore, Ahmedabad, and Mumbai, with hands-on projects, internships, and placement support. Flexible learning options allow students to choose between online or offline modes while gaining the same comprehensive training, practical applications, and career-building opportunities. Mastering correlation in Data Science empowers students to analyze relationships between variables, enhance predictive modeling, and build a strong foundation for a successful career in Data Science.

