Essential Tools for Data Analysts: Excel, SQL, Python, and More
Discover the must-have tools for data analysts, from Excel for quick analysis to SQL for database management and Python for automation. Learn how these tools streamline data handling and decision-making.
In today's digital landscape, data has emerged as a critical asset for businesses, shaping decisions and driving strategies across all sectors. As the volume of data generated continues to skyrocket, companies are turning to data analysts to help decode the complexity of this information, ensuring they stay ahead in a competitive marketplace.
Data analysts are pivotal in converting raw data into meaningful insights. They uncover patterns, interpret key findings, and deliver recommendations that inform strategic decisions. This blog delves into the role of data analysts, the essential skills and tools they utilize, and their overall impact on modern business operations.
Defining the Role of a Data Analyst
A data analyst is a specialist who gathers, processes, and examines data to align with business goals. Their main role is transforming raw data into actionable insights, enabling organizations to make strategic decisions. This involves a diverse range of tasks that call for strong analytical abilities, technical expertise, and an understanding of business dynamics.
Key Functions of a Data Analyst
- Data Collection and Cleaning: Analysts collect information from multiple sources and focus on validating its precision and trustworthiness by thoroughly cleaning and preparing the data for use.
- Data Analysis and Interpretation: Analysts apply statistical techniques to analyze complex datasets, revealing underlying trends and patterns.
- Reporting and Visualization of Findings: Clear communication is crucial, as analysts convey their insights through reports and visualizations that transform complex data into easily understandable information for stakeholders.
By performing these essential functions, data analysts enable organizations to strategically harness data, thereby improving their decision-making processes.
The Bureau of Labor Statistics (BLS) forecasts that employment for data analysts, often classified under the broader term "data scientists," will increase by 31% from 2020 to 2030 in the United States, significantly outpacing the average growth rate for all occupations.
In India, the average annual salary for a data analyst is estimated at ₹7,00,000. In the United States, the estimated total compensation for a data analyst is approximately $84,232 per year, while in London, United Kingdom, it stands at £39,538 annually, according to Glassdoor.
Read these articles:
- Key Skills Every Data Analyst Needs
- Data Analyst vs. Data Scientist
- Introduction to SQL for Data Analytics
Importance of Data Analysts in Organizations
Data analysts play a crucial role in organizations across various industries, driving data-informed decision-making and enhancing operational efficiency. Here are several key points that underscore their significance:
Driving Decision-Making
Data analysts significantly influence strategic decisions within organizations. By offering data-driven insights, they enable leaders to grasp market dynamics, customer preferences, and operational effectiveness. This capability enables companies to make informed choices, ultimately leading to improved performance and profitability.
Enhancing Efficiency
Besides making decisions, data analysts also uncover inefficiencies in business processes. Through careful analysis, they highlight areas where improvements can be made, whether through optimizing resource allocation or streamlining operations. Their insights often lead to increased productivity and reduced costs.
- Market Insights: Data analysts play a pivotal role in understanding customer behavior, which informs marketing strategies and product development.
- Forecasting Trends: By analyzing historical data, they can predict future trends, helping organizations stay ahead of the competition.
Data analysts play a crucial role in advancing strategic initiatives and enhancing operational efficiencies across a range of industries.
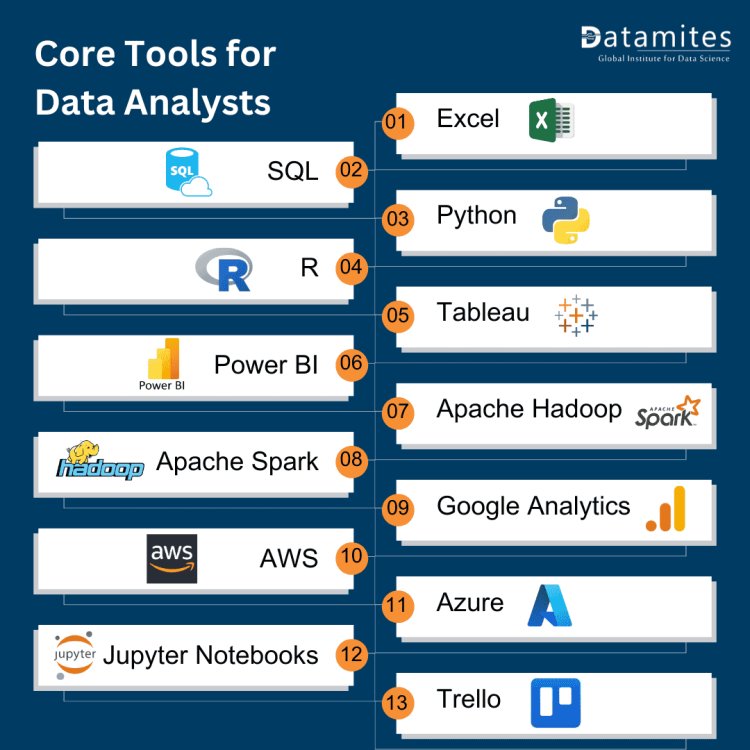
Core Tools for Data Analysts
Data analysts use a wide range of tools to gather, analyze, and interpret data, turning raw information into actionable insights that drive informed decision-making. Here’s a breakdown of some core tools commonly utilized in the field:
Excel: The Classic Companion
Microsoft Excel remains one of the most widely used tools among data analysts. It offers an extensive array of features, encompassing a broad spectrum of functionalities.
- Formulas and Functions: Users can perform complex calculations easily.
- Pivot Tables: Excel allows for quick data summarization and analysis.
- Data Visualization: It offers an extensive array of features, encompassing a broad spectrum of functionalities.
Use Cases and Benefits
Excel is particularly beneficial for small to medium-sized datasets. Analysts can utilize it for financial modeling, budgeting, and rapid data analysis. However, while Excel is powerful, it has limitations, especially when dealing with vast datasets.
- Limitations: Handling large data sets can lead to performance challenges, making it less ideal for big data applications.
- When to Consider Other Tools: For more intricate analyses, experts frequently rely on specialized software or programming languages to deepen their insights.
SQL: The Database Language
SQL is a vital tool for data analysts who interact with databases. It allows users to communicate with relational databases to retrieve, manipulate, and manage data effectively.
Common SQL Operations
Some of the fundamental SQL operations include:
- SELECT: Retrieve specific data from a database.
- JOIN: Combine data from multiple tables.
- GROUP BY: Aggregate data to analyze trends.
Real-World Applications
SQL is utilized across numerous sectors, including finance and healthcare, to effectively manage and analyze substantial amounts of data. Its capacity to execute intricate queries makes it an essential skill for data analysts.
Python: The Versatile Powerhouse
Python has emerged as a favored programming language for data analysis due to its robust capabilities. Its clarity and adaptability contribute to its widespread appeal among data analysts.
Key Libraries for Data Analytics
Python boasts several libraries that enhance its functionality, including:
- Pandas: Essential for data manipulation and analysis.
- NumPy: Useful for numerical computations.
- Matplotlib and Seaborn: Libraries for building static, animated, and interactive visual representations.
Advantages of Python
Python's versatility empowers analysts to streamline repetitive tasks, perform intricate data analyses, and generate comprehensive visualizations. Moreover, its community support and extensive libraries enable continuous learning and skill enhancement.
R: The Statistical Specialist
R is a programming language tailored for in-depth statistical analysis and data visualization. It is particularly popular in academia and among statisticians due to its rich ecosystem of statistical packages.
Key Libraries and Tools
Here are some key libraries in R that are considered essential:
- ggplot2: Excellent for creating advanced visualizations.
- dplyr: Enables straightforward data manipulation through an intuitive syntax.
- tidyr: Helps in tidying messy data for analysis.
Use Cases in Academia and Industry
R is widely employed for statistical analysis and data visualization in numerous fields, such as finance, healthcare, and marketing. Its versatility makes it a go-to tool for professionals aiming to derive insights from complex data in these industries. Its ability to handle complex analyses makes it invaluable for academic researchers and data scientists alike.
Data Visualization Tools
Here’s an in-depth comparison between two of the most popular data visualization platforms: Tableau and Power BI. This analysis highlights their main features, strengths, and practical applications.
Tableau: The Visualization Virtuoso
Tableau is a premier data visualization platform that empowers data analysts to design interactive and shareable dashboards. Its user-friendly interface allows for easy data exploration.
Key Features and Benefits
- Drag-and-Drop Functionality: Users can easily create visualizations without extensive coding knowledge.
- Integration: Tableau seamlessly integrates with various data sources, ranging from spreadsheets to databases.
Examples of Dashboards
Tableau is widely used by analysts to create dashboards that track key performance indicators (KPIs), visualize sales data, and assess marketing strategies. Its capability to convert complex data into visually appealing insights has made it a favored tool for businesses.
Power BI: The Microsoft Powerhouse
Microsoft Power BI is a business intelligence tool that transforms raw data into actionable insights, enabling better decision-making. It is particularly useful for organizations that already use Microsoft products.
Key Functionalities
- Data Connectivity: Power BI can connect to numerous data sources, simplifying data retrieval.
- Real-Time Reporting: Users can create dynamic reports that update in real time.
Case Studies
Power BI has proven effective across various industries, including retail, where it aids in analyzing sales trends and enhancing inventory management. Its capacity to deliver quick insights empowers organizations to make informed decisions promptly.
Big Data Tools
Here's an overview of Apache Hadoop and Apache Spark, focusing on their features, benefits, and applications in the big data landscape.
Apache Hadoop: The Big Data Foundation
Apache Hadoop is an open-source framework designed for the distributed storage and processing of vast datasets. It has emerged as a fundamental component of numerous big data solutions.
Use Cases and Benefits
- Distributed Storage: Hadoop is capable of managing petabytes of data, making it an ideal choice for organizations that work with extensive datasets.
- Scalability: Its design facilitates seamless scalability, making it capable of handling increasing data requirements.
Hadoop's capacity to handle vast amounts of data effectively is crucial for data analysts engaged in big data initiatives.
Apache Spark: The Fast Processing Engine
Apache Spark is a powerful open-source processing engine designed for speed and ease of use. It performs exceptionally well in both batch processing and real-time data handling.
Comparison with Hadoop
Although Hadoop excels at batch processing, Spark outshines it with its faster performance and ability to manage real-time data analytics. This capability positions Spark as the preferred option for organizations seeking rapid data processing solutions.
Applications in Real-Time Processing
Spark is utilized across a range of applications, including fraud detection, where the ability to process data in real time is essential. Its speed and versatility significantly boost the effectiveness of data analysts who work with ever-changing datasets.
Cloud-Based Tools
Here’s a detailed summary of the information regarding cloud-based tools, with particular emphasis on Google Analytics, AWS, and Azure in the context of data analytics.
Google Analytics: Understanding Web Behavior
Google Analytics is a powerful web analytics tool that offers valuable insights into how users interact with websites, making it crucial for digital marketing and e-commerce enterprises.
Key Features
- User Tracking: Monitor user interactions, traffic sources, and conversion rates.
- Reporting Tools: Generate tailored reports to analyze data efficiently.
Google Analytics provides marketers and analysts with valuable insights into website performance, facilitating informed, data-driven decision-making.
AWS and Azure for Data Analytics
Amazon Web Services (AWS) and Microsoft Azure provide powerful cloud solutions for data storage and processing, offering critical tools for data analysts who want to harness the potential of cloud technology.
Key Services Offered
AWS Redshift: A data warehousing solution designed for rapid querying and analysis of extensive datasets.
Azure Synapse: Combines big data and data warehousing to enable in-depth analytics.
Benefits of Cloud-Based Solutions
Cloud solutions offer scalability and flexibility, enabling organizations to adjust to evolving data requirements. This feature is crucial for data analysts seeking to manage large datasets effectively.
Collaboration and Project Management Tools
Here’s a comprehensive overview of collaboration and project management tools, specifically emphasizing Jupyter Notebooks alongside platforms such as Trello and Asana. This summary outlines their key features, advantages, and best practices for optimizing project management effectiveness.
Jupyter Notebooks: The Interactive Environment
Jupyter Notebooks provide an interactive coding environment that allows data analysts to write code, visualize data, and share insights seamlessly.
Benefits for Data Analysis Projects
- Collaboration: Analysts can share notebooks with stakeholders for collaborative analysis.
- Documentation: Notebooks can act as detailed records of the data analysis workflow.
Jupyter Notebooks facilitate transparency and collaboration, enhancing the overall efficiency of data analysis projects.
Trello/Asana: Managing Projects Effectively
Trello and Asana are widely-used project management tools that assist data teams in organizing tasks and monitoring progress. These platforms facilitate efficient collaboration and enhance project management.
Importance of Collaboration
- Task Tracking: Teams have the ability to delegate tasks, establish deadlines, and track progress.
- Communication: Project management tools enhance communication efficiency among team members.
To effectively utilize these tools, it's important to establish clear goals, provide consistent updates, and maintain open lines of communication, all of which help keep data analysis projects on course.
Read these articles:
- What is Datamites Certified Data Analyst Certification
- Data Analyst Course Fee in India
- Data Analyst Career Scope in India
The Data Analysis Process
The data analysis process involves a structured method for converting raw data into valuable insights. Below is a detailed breakdown of the steps involved, as well as an example case study for clarity.
Steps in the Analysis Process
The process of data analysis generally consists of several key steps:
- Defining the Problem and Objectives: Clearly outline the analysis goals and questions.
- Data Collection and Cleaning: Collect data and enhance its quality by performing cleaning processes.
- Exploratory Data Analysis (EDA): Explore data to identify patterns and trends.
- Statistical Modeling and Hypothesis Testing: Apply statistical techniques to test hypotheses.
- Interpretation and Reporting of Results: Communicate findings effectively to stakeholders.
Case Study Example
A retail business aims to enhance its inventory management processes for greater efficiency. A data analyst would follow the steps outlined above, starting with defining the problem of excess stock. After collecting and cleaning sales data, they would perform exploratory analysis, leading to actionable insights that help reduce costs and improve stock turnover.
In summary, data analysts are essential in today’s data-driven world. They leverage various tools, from Excel and SQL to Python and Tableau, to extract insights and support decision-making. Continuous learning and adaptation to new tools are vital for success in the dynamic field of data analytics.
This comprehensive overview of essential tools and processes for data analysts provides a solid foundation for anyone interested in pursuing a data analyst course, data analyst training, or data analyst certification. With the right tools and knowledge, aspiring analysts can make meaningful contributions to their organizations.
DataMites Institute is a leading provider of data science and analytics training, dedicated to empowering individuals with the skills to thrive in the digital economy. Our Data Analyst Training Course is accredited by IABAC and NASSCOM FutureSkills, ensuring a robust and industry-relevant learning experience. We offer comprehensive courses in Data Science, Artificial Intelligence, Machine Learning, and more, designed for both beginners and seasoned professionals. At DataMites, we focus on practical learning, equipping students with hands-on experience and real-world applications. Join us to unlock your potential and become a proficient data-driven decision-maker in today’s competitive landscape!