Hypothesis Testing in Data Science Explained with Real-Life Examples
This blog breaks down hypothesis testing in data science with clear, real-world examples. You'll see how to frame assumptions, run tests, and make decisions backed by data.
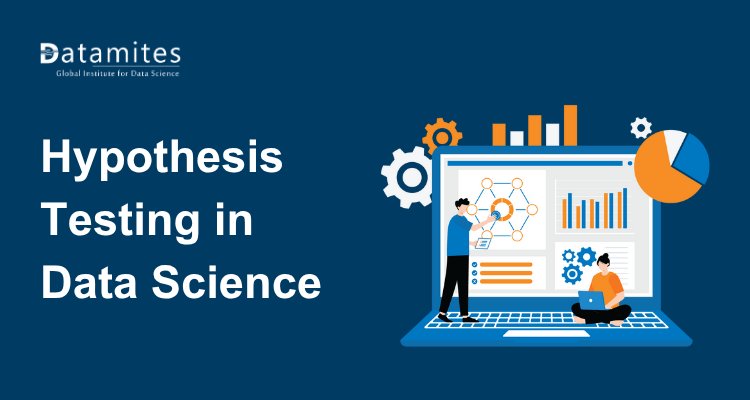
Data alone doesn’t say much. What matters is how you use it and hypothesis testing is one of the sharpest tools for turning data into insight. Whether you're starting a data science course or aiming to grow your career in data science, this concept isn’t optional. It’s essential for making decisions that are backed by evidence, not assumptions.
If you’re exploring the scope of data science, learning how to test ideas with data gives your analysis real credibility. Hypothesis testing in data science helps you spot what’s real, what’s noise, and what’s worth acting on. Let’s break down what it is, how it works, and why it matters with real-world context and zero fluff.
What is Hypothesis Testing in Data Science?
Hypothesis testing is how we use data to make decisions. You start with a question, form a hypothesis, and test it with sample data to see if there’s real evidence behind it.
In data science, this often means translating business questions into something testable. For example, testing if a new website layout increases purchases. You set up two competing ideas: the null hypothesis (H₀) says nothing changed, while the alternative hypothesis (H₁) says something did. Then, you let the data speak. This approach shows up everywhere from product tweaks to clinical research.
Types of Hypothesis Testing (With Use Cases)
Here’s where it gets interesting. There are different types of hypothesis testing depending on the kind of data and question you’re tackling. Let’s look at the most commonly used ones in data science applications:
Understanding the types of hypothesis testing is essential if you're working on real business problems, product experiments, or studying in a data science course. Each test has a purpose, and choosing the right one can make or break your analysis.
1. One-Sample T-Test
- What it does: Tests if the mean of a single group differs from a known value.
- Use case: You’re running a data science training program and want to check if the average test score of the latest batch is higher than the institute’s historical average.
2. Two-Sample T-Test (Independent T-Test)
- What it does: Compares means between two unrelated groups.
- Use case: Comparing average salaries between people who completed a data science course online vs offline.
Helps evaluate different delivery formats in the best data science institute.
3. Paired Sample T-Test
- What it does: Compares means before and after an intervention in the same group.
- Use case: You want to test whether a new teaching method improves students’ final grades in your offline data science course by comparing pre- and post-assessment scores.
4. Z-Test
- What it does: Similar to the t-test but used when population variance is known and sample size is large.
- Use case: You're assessing if the mean time to complete a machine learning module has significantly changed year-over-year at a data science institute with thousands of learners.
5. Chi-Square Test
- What it does: Tests relationships between categorical variables.
- Use case: Are certification completion rates dependent on age group or region? Use the Chi-Square Test to find out if your applications of data science are equally effective across user segments.
6. ANOVA (Analysis of Variance)
- What it does: Compares the means of 3 or more groups.
- Use case: Compare learner satisfaction across three different formats, weekend batch, weekday batch, and fast-track for a career in data science.
- Reveals subtle differences that wouldn't show up in a simple t-test.
7. Mann-Whitney U Test
- What it does: A non-parametric alternative to the two-sample t-test. Use when data isn't normally distributed.
- Use case: Comparing time spent on learning platforms between beginners and experienced professionals without assuming normality.
8. Wilcoxon Signed-Rank Test
- What it does: Non-parametric version of the paired t-test.
- Use case: You test whether performance scores improved after integrating new data science tools for students with non-normal data distribution.
9. A/B Testing (a practical wrapper of hypothesis testing)
- What it does: Compares two versions of a product, feature, or experience.
- Use case: You launch two landing pages for a data science course and want to see which one results in more sign-ups. A/B testing wraps a two-sample t-test with a business context.
Each test has its place in the toolbox. Mastering these is key to building skills in data science that employers look for.
Refer to these articles:
- Mastering Data Wrangling in Data Science
- Ethical Challenges in Data Science 2025
- How To Become A Data Scientist
Why Hypothesis Testing is Important in Data Science
Here’s the thing: without hypothesis testing, you’re guessing.
Hypothesis testing for beginners often feels like a lot of formulas, but the principle is simple, it gives structure to decision-making. It helps separate noise from real signals.
In data science, this is huge. You don’t want to act on every blip in your dashboard. You want to act on what’s statistically meaningful.
Real-World Impact
- In e-commerce, hypothesis testing prevents premature decisions based on short-term spikes.
- In fintech, it validates whether a change in interest rate models actually reduces risk.
- In healthcare, it confirms if a new algorithm improves diagnosis accuracy.
According to a 2025 report from Kaggle, over 68% of practicing data scientists said hypothesis testing is part of their regular workflow. It's foundational to skills in data science, whether you’re doing machine learning, dashboarding, or experimentation.
A Step-by-Step Guide to Hypothesis Testing in Data Science
Let’s walk through a simplified version that you’d encounter in a typical data science career project.
Step 1: Define the Hypotheses
Let’s say you believe students who attend live classes perform better than those who only watch recordings.
- H₀: There’s no difference in average scores.
- H₁: Live class students score higher.
Step 2: Choose a Significance Level
Usually, you pick a p-value threshold of 0.05 (or 5%). This is the probability of rejecting the null when it’s actually true.
Step 3: Select the Right Test
This could be a t-test (two groups, unknown population variance).
Step 4: Run the Test Using Tools
You can do this using data science tools like Python (SciPy), R, or even Excel.
Step 5: Interpret the Results
If the p-value in hypothesis testing is less than 0.05, you reject the null. Your data supports the claim that live classes improve performance.
This workflow isn’t just academic, it's how you solve real problems across the applications of data science.
Refer to these articles:
- Why Do You Need Data Science for Business
- The Rise of Data Science in the Agriculture Industry
- How Data Science is Shaping the Healthcare Industry
Best Practices for Using Hypothesis Testing in Data Science
Let’s keep this practical. Here’s how to avoid rookie mistakes:
- Define Clear Hypotheses: Set up your null and alternative hypotheses before touching the data.
- Ask Specific Questions: Frame your test around a measurable, focused outcome.
- Check Test Assumptions: Validate normality, independence, and variance assumptions before running the test.
- Avoid P-Hacking: Don’t keep testing until you get the result you want, stick to your original plan.
- Focus on Practical Significance: A small p-value doesn’t always mean the result matters.
- Use the Right Sample Size: Calculate power and sample size in advance to avoid under- or over-testing.
- Visualize Your Data: Use plots to see patterns beyond the p-value.
- Document Everything: Record your hypotheses, methods, assumptions, and results clearly.
- Learn from Non-Significant Results: Negative results can be just as valuable for decision-making.
- Practice with Real-Life Examples: Apply these skills to real datasets, learning by doing is key.
These best practices help you avoid misinterpretation, a common pitfall even among experienced analysts.
Top Tools Every Data Scientist Should Use for Hypothesis Testing
Every modern data scientist needs a solid toolkit. Here’s what the pros rely on for hypothesis testing:
- Python (SciPy, Statsmodels, Pandas): Flexible and intuitive for statistical testing.
- R: Favored by statisticians; built-in functions like t.test() make testing simple.
- Excel: Handy for small-scale testing and quick analysis.
- Tableau / Power BI: Ideal for visualizing and presenting test results.
- Jupyter / Google Colab: Great for combining code, output, and documentation.
- JASP / Jamovi: No-code platforms for easy hypothesis testing.
- SPSS / SAS: Widely used in healthcare and enterprise environments.
- Minitab: Tailored for quality control and Six Sigma workflows.
- Apache Spark (PySpark): Suitable for testing at big data scale.
- SQL: Key for preparing data and running initial comparisons.
Learning how to use these data science tools is a must for anyone planning to become a data scientist. If you’re serious, enroll in a data science institute that includes hands-on work with these platforms.
Refer to these articles:
Hypothesis testing isn’t just theory, it’s how data becomes action. Whether you’re in tech, healthcare, finance, or retail, knowing how to define a null and alternative hypothesis, calculate a p-value, and choose the right test type turns basic analysis into real insight.
If you're serious about a career in data science, look for a data science course or data science institute that teaches these core statistical methods. According to the 2025 update from the Bureau of Labor Statistics, projects a 36% growth in employment for data scientists between 2023 and 2033. Mastering skills like hypothesis testing gives you a real edge. Let the data guide your decisions, that’s what separates a good analyst from a true data scientist.
Understanding hypothesis testing is important, but data science is more than just techniques. It’s about how we collect, analyze, and use data responsibly. Companies that focus on ethics and responsible AI don’t just follow rules, they build trust. If you're serious about this field, find a data science institute in Hyderabad that teaches both the technical skills and the right mindset.
DataMites Institute Is one of the leading data science training institutes in Bangalore, it offers a Certified Data Scientist program designed for real-world application. The curriculum blends core concepts like Python, data structures, machine learning, and time series forecasting with hands-on training in R, SQL, Tableau, and Power BI, making it especially valuable for mastering applied techniques in data science.
Alongside its program, DataMites also offers focused tracks like Python for Data Science, Marketing Analytics, and Data Science for Managers. Backed by accreditations from IABAC and NASSCOM FutureSkills, and recognized by Analytics India Magazine as one of the top institutes in India alongside IIT and IIM, DataMites combines flexibility with career support. For anyone looking to study at a reputed offline data science institute in Bangalore, it’s a strong choice for building the technical and ethical foundation needed to thrive in this field.

