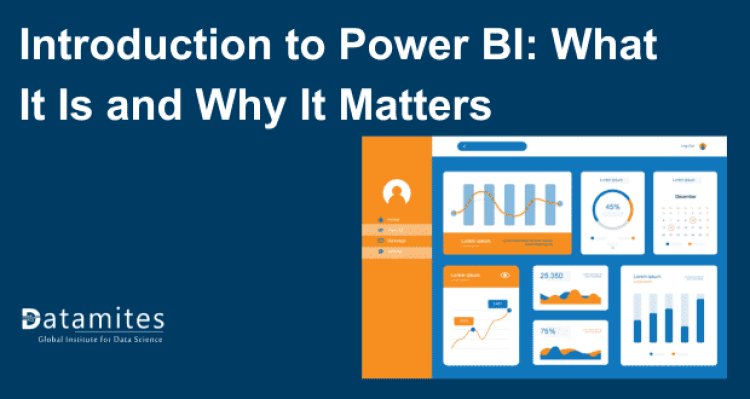
Introduction to Power BI: What It Is and Why It Matters
Power BI is a powerful business intelligence tool that transforms raw data into interactive dashboards and insights. This blog explores what Power BI is, its key features, and why it’s essential for data-driven decision-making.
In a world driven by data, where insights pave the way for informed decisions, have you ever wondered how businesses harness the power of information? What if there was a tool that could not only analyze vast datasets effortlessly but also visualize them in ways that uncover hidden trends and opportunities?
Power BI is a tool from Microsoft that takes raw data and turns it into easy-to-understand charts and reports. It assists businesses in rapidly comprehending their data. According to a recent report by Gartner, the global business intelligence and analytics market is expected to reach $34 billion by 2025, highlighting the growing importance of such technologies. But what exactly is Power BI, and why is it becoming indispensable for organizations worldwide? Let's explore the foundational aspects of Power BI and see how it can transform your methods for analyzing and visualizing data.
Definition and Overview of Power BI
Power BI comprises a robust suite of tools tailored for businesses to analyze data effectively and convey actionable insights. It helps organizations see their data in new ways, making it easier to understand trends and make informed decisions. With Power BI, you can create interactive charts, graphs, and reports that are easy to share across your company or integrate into other applications and websites.
One of its key strengths is its user-friendly interface, which allows non-technical users to build their own reports and dashboards without needing help from IT professionals. This self-service capability enables employees to independently explore data and discover valuable insights without any delays. Power BI also supports a wide range of data sources, from simple spreadsheets to complex databases and cloud services.
Read these articles:
Why Power BI is so Important
Power BI has revolutionized the way organizations handle data analytics, offering a comprehensive suite of features that cater to both technical and non-technical users alike. Here are several significant reasons why Power BI is important:
- Data Visualization: It has a knack for converting intricate data into visually engaging and easy-to-understand reports and dashboards. This is crucial for decision-making as it allows users to grasp insights quickly.
- Integration: It seamlessly integrates with various data sources, including Microsoft products like Excel and Azure, as well as third-party services. This makes it versatile and adaptable to different data environments.
- Scalability: Power BI effectively scales from small businesses to large enterprises. It handles vast amounts of data and supports extensive customization and automation through APIs and developer tools.
- Accessibility: It enables users at every level of an organization to access and analyze data independently, fostering the democratization of data. Its user-friendly interface and intuitive design empower users without extensive technical expertise.
- Real-time Insights: With real-time data analysis capabilities, Power BI helps organizations stay responsive and proactive, enabling timely decision-making based on the latest information.
- Cloud Capabilities: As a cloud-based service, it offers benefits like easy deployment, automatic updates, and the ability to collaborate and share reports securely across different devices and platforms.
- Cost-effectiveness: Compared to traditional BI solutions, Power BI is often more cost-effective due to its subscription-based pricing model and the elimination of hardware and maintenance costs.
Components of Power BI
Power BI, a product of Microsoft, is a powerful business intelligence tool designed to help organizations visualize data and share insights across the company. It consists of several key components:
- Power BI Desktop: This is a Windows desktop application used for creating reports and data visualizations on your local machine. It allows you to connect with various data sources, handle data, and generate interactive reports and dashboards.
- Power BI Service (Power BI online): This is a cloud-based service (also known as Power BI online) where you can publish your Power BI reports and dashboards. It enables collaboration, sharing, and viewing of reports across your organization. Users can access reports via web browsers or mobile devices.
- Power BI Mobile Apps: These mobile applications are accessible on iOS, Android, and Windows devices. They allow users to view and interact with Power BI reports and dashboards on the go, providing a responsive and accessible way to consume data insights.
- Power BI Gateway: This is a bridge that connects Power BI Service with on-premises data sources. There are two types of gateways:
- On-premises data gateway: Enable Power BI to establish connections with on-premises data sources such as SQL Server, SharePoint, and others.
- Personal gateway: Designed for personal use to regularly update data from on-site data sources on a predefined schedule.
- Power BI Report Server: This is an on-premises report server that allows organizations to host Power BI reports locally. It integrates with SQL Server Reporting Services (SSRS), allowing organizations to oversee and distribute Power BI reports within their own infrastructure.
- Power BI Embedded: Developers can integrate Power BI reports and dashboards into custom applications using this feature. It provides APIs (Application Programming Interfaces) for embedding visuals, managing data, and controlling user access programmatically.
- Power Query: This tool, available in both Power BI and Excel, facilitates data connectivity, preparation, and cleaning from diverse sources before importing into Power BI for analysis and visualization.
Each component plays a crucial role in the end-to-end process of data analysis and visualization, catering to different user needs and scenarios.
Read these articles:
- Why You Need to Have Microsoft Power BI Skills
- Top 10 Career Paths in Microsoft Power BI
- The Transformative Impact of Microsoft Power BI in Business
Real-Time Applications of Power BI
Power BI, developed by Microsoft, is a robust business intelligence tool widely utilized across diverse industries for real-time applications. Here are some common real-time applications of Power BI:
- Monitoring Operational Metrics: Power BI can be used to monitor real-time operational metrics such as production line efficiency, sales performance, website traffic, and customer support tickets. This enables businesses to promptly make decisions using current information.
- Financial Analytics: For finance departments, Power BI can provide real-time insights into financial data, including cash flow analysis, budget vs. actuals, and financial forecasting. This helps in making informed financial decisions promptly.
- Sales and Marketing Dashboards: Power BI enables real-time tracking of sales pipelines, conversion rates, customer acquisition costs, and marketing campaign effectiveness. This allows sales and marketing teams to adjust strategies in real-time for better performance.
- IoT Data Analysis: With its streaming data capabilities, Power BI can analyze real-time data from Internet of Things (IoT) devices. This is useful in industries like manufacturing, utilities, and smart cities for monitoring equipment performance and predicting maintenance needs.
- Supply Chain Management: Power BI can integrate with supply chain systems to provide real-time visibility into inventory levels, supplier performance, and logistics tracking. This contributes to enhancing inventory management efficiency and optimizing supply chain operations.
- Healthcare Analytics: In healthcare, Power BI can analyze real-time patient data, hospital operations, and clinical outcomes. It allows healthcare providers to track patient trends, manage resource utilization, and enhance overall operational efficiency.
- Real-Time Customer Insights: Power BI can integrate with customer relationship management (CRM) systems to provide real-time insights into customer behavior, preferences, and satisfaction levels. This helps businesses in personalizing customer interactions and improving customer retention.
- Risk Management: Real-time dashboards in Power BI can monitor risk indicators across various aspects of the business, such as compliance violations, cybersecurity threats, and market fluctuations. This allows organizations to mitigate risks promptly.
By leveraging real-time data analytics, organizations can respond swiftly to changes in the market, customer behavior, or operational challenges.
Refer these articles:
- What is Certified Python Developer?
- What is Certified Data Scientist Course?
- What is Datamites Certified Data Analyst Certification Course?
Power BI Job Roles and Responsibilities
The adoption of Power BI has created demand for various job roles dedicated to managing and utilizing its capabilities:
| Job Roles | Responsibilities |
| Power BI Developer |
1. Designing and overseeing Power BI reports and dashboards. 2. Consolidate data from multiple sources while maintaining data accuracy. |
| Power BI Analyst |
1. Analyze and interpret data to provide actionable insights. 2. Create visual reports and dashboards to support business decisions. |
| Power BI Architect |
1. Design and implement Power BI architecture and solutions. 2. Ensure scalability and performance optimization of Power BI systems. |
| Power BI Consultant |
1. Provide expert advice on Power BI best practices and solutions. 2. Train and support clients in using Power BI effectively. |
| Power BI Administrator |
1. Manage and maintain the Power BI environment and user access. 2. Monitor system performance and troubleshoot issues. |
| Power BI Data Engineer |
1. Extract, transform, and load (ETL) data for Power BI reports. 2. Ensure data quality and consistency across data sources. |
These roles require a blend of technical skills in data analysis, visualization, and business acumen to effectively leverage Power BI's capabilities and drive business outcomes.
Power BI is renowned for its versatility and robust capabilities in the field of business intelligence and data analytics. Its ability to democratize data, provide real-time insights, and integrate seamlessly with existing Microsoft technologies makes it indispensable for modern businesses seeking to thrive in a data-centric environment. Whether you're considering a career in data analytics or looking to enhance your organization's analytical capabilities, investing in Power BI training, such as a Power BI course or certification, can open up a realm of opportunities and efficiencies.
Power BI isn't just a tool; it's a strategic advantage that empowers organizations to turn data into actionable insights, driving smarter decisions and sustainable growth.
DataMites offers a globally accredited Power BI course, empowering professionals with advanced data visualization and analytics skills. With expert-led training and real-world projects, learners gain hands-on expertise in data modeling, DAX, and dashboard creation. Recognized among India's top analytics institutes, DataMites ensures industry-aligned education for career growth. Master Power BI with DataMites and excel in data-driven decision-making!
DataMites Institute offers an intensive Power BI Training Course designed to equip students with comprehensive skills in business intelligence and data visualization. Accredited by IABAC, this course spans a duration of 3 months, ensuring in-depth learning through live interactive projects and real-world client engagements.
DataMites Institute is a global leader in data science education, renowned for its comprehensive courses and industry-relevant training. Specializing in a range of cutting-edge disciplines including data analytics, machine learning, artificial intelligence, python programming, data engineering, MLOps, and more.

