Python for Data Analysis: Beginner Guide
Unlock the power of Python for data analysis with this beginner-friendly guide, covering essential tools like Pandas, NumPy, and Matplotlib. Learn to clean, visualize, and interpret data effortlessly!
Data is being generated at an unprecedented pace every minute. Organizations, meanwhile, are constantly seeking ways to extract meaningful insights from this vast pool of information, making Python data analysis an essential skill for aspiring professionals. According to Fortune Business Insights Report, The global data analytics market is projected to expand from USD 41.05 billion in 2022 to USD 279.31 billion by 2030, reflecting a compound annual growth rate (CAGR) of 27.3%, underscores the escalating future demand for data analytics solutions.
This is where data analytics plays a vital role in ensuring business success. It has become an essential tool for companies to enhance profitability and drive growth. In this article, we will explore data analytics using Python.
What is Data Analysis and its Type?
Data analysis is the process of examining, transforming, and interpreting data to extract valuable insights. It plays a crucial role in industries such as healthcare, finance, marketing, and technology. There are different types of analysis of data.
Data analytics can be classified into 3 types:
- Descriptive Analysis – This type focuses on summarizing historical data to understand past trends and patterns.
- Predictive Analysis – This type utilizes statistical models and machine learning techniques to forecast future trends.
- Prescriptive Analysis – This type goes beyond predictions by providing actionable recommendations.
Organizations use data analysis tools in research and real-time analytics to drive business decisions, making Python data analysis an in-demand skill.
Why Python is Essential for Data Analysis?
There are many programming languages available, but Python is widely preferred by statisticians, engineers, and scientists for conducting data analytics. Here are some key reasons behind the growing popularity of Data Analytics using Python.
- Ease of Learning: Python has a simple syntax, making it easy for beginners to understand.
- Extensive Libraries: Libraries such as Pandas, NumPy, and Matplotlib facilitate data manipulation and visualization.
- Scalability: Python is used by the best companies for data analyst roles due to its ability to handle large datasets.
- Community Support: Python has a vast global community, providing extensive resources and support.
Refer to the articles below:
What Are the Core Python Fundamentals for Data Analysis?
To start with Python data analysis, beginners need to focus on:
- Python Basics: Variables, loops, conditional statements, and functions.
- Data Structures: Lists, dictionaries, tuples, and sets.
- Libraries for Data Analysis: Pandas for data manipulation, NumPy for numerical computing, and Matplotlib for visualization.
- Data Cleaning and Transformation: Handling missing values, filtering data, and reshaping datasets.
- Correlation Analysis in Data Mining: Understanding relationships between variables to draw meaningful conclusions.
- Data Analysis Dashboard Development: Creating interactive dashboards for visual representation of data.
Mastering these concepts will help beginners learn the basics of Python and prepare for data analytics roles.
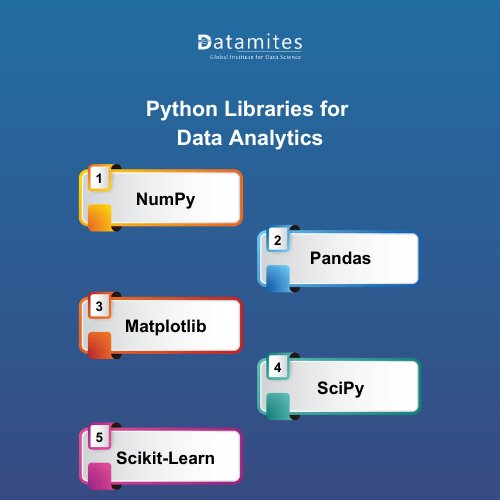
What Are the Python Libraries for Data Analytics?
Python for beginners offers a gentle introduction to programming, making it an ideal choice for those new to coding. Python's extensive libraries, such as NumPy and Pandas, have made it a preferred choice for data analysis.
- NumPy: A fundamental library for numerical computing in Python, NumPy introduces support for large, multi-dimensional arrays and matrices, along with an extensive collection of mathematical functions to operate on them. Its capabilities in linear algebra, random number generation, and Fourier transforms make it indispensable for scientific computations.
- Pandas: Built on top of NumPy, Pandas offers data structures and functions designed to work with structured data easily and intuitively. It provides DataFrame and Series objects for efficient data manipulation, enabling tasks such as data cleaning, transformation, and analysis, which are essential in data science workflows.
- Matplotlib: A versatile plotting library, Matplotlib enables the creation of static, animated, and interactive visualizations in Python. It offers a flexible framework for generating plots, charts, and graphs, making it a cornerstone tool for data visualization and presentation.
- SciPy: Extending the functionality of NumPy, SciPy provides modules for optimization, integration, interpolation, eigenvalue problems, algebraic equations, and other tasks common in science and engineering. Its comprehensive suite of tools facilitates complex scientific and technical computing.
- Scikit-Learn: Built on NumPy and SciPy, Scikit-Learn is a robust library offering simple and efficient tools for predictive data analysis. It includes a wide range of machine learning algorithms for classification, regression, clustering, and more, along with utilities for model selection, validation, and preprocessing, making it essential for building and evaluating machine learning models.
Read the articles below:
- What would be the Python Course Fee in India
- Python Programming Career Scope in India
- Data Science Career Scope in India
Job Opportunities in Python for Data Analysis?
If you're learning Python with data analysis, various job roles are available in the market. Below are some of the key opportunities you can explore:
- Data Analyst Associate: Assists in gathering, processing, and analyzing data to support business decision-making. This role involves working with large datasets, generating reports, and utilizing data visualization tools like Tableau or Power BI. Entry-level professionals in this role develop analytical skills and gain experience in data-driven problem-solving.
- Operations Analyst: They focus on improving business processes by evaluating operational data and identifying inefficiencies. They analyze workflow patterns, resource allocation, and performance metrics to enhance productivity. Their insights help organizations streamline operations, reduce costs, and optimize overall business performance using data-driven strategies.
- Risk Analyst: Specializes in assessing potential financial, operational, or strategic risks by analyzing historical and real-time data. They develop predictive models to forecast uncertainties, ensuring informed decision-making in sectors like banking, insurance, and investments.
- Business Intelligence Analyst: Transforms raw data into meaningful insights to drive strategic business decisions. They create dashboards, reports, and visualizations using business intelligence tools, allowing companies to identify trends, opportunities, and challenges.
- Marketing Data Analyst: Examines customer behavior, market trends, and campaign performance to optimize marketing strategies. By leveraging analytics tools, they track key performance indicators (KPIs), segment audiences, and refine digital marketing campaigns.
- Financial Data Analyst: Analyzes financial statements, market data, and investment trends to assess risks and identify growth opportunities. They use statistical models and forecasting techniques to guide financial planning, budgeting, and investment strategies.
How Can Beginners Learn the Basics of Python for Data Analysis?
Starting with Python for beginners requires a structured approach. Follow these steps:
- Understand the Data Analyst Role: Grasp the responsibilities and tasks of a data analyst to align your learning objectives effectively.
- Learn Essential Tools and Technologies: Master Python programming, along with libraries like pandas and NumPy, to handle and analyze data efficiently.
- Gain Practical Experience: Engage with real-world datasets through platforms like Kaggle to apply your skills in authentic scenarios.
- Develop a Portfolio: Compile your projects and analyses to showcase your capabilities to potential employers or collaborators.
- Enhance Soft Skills: Cultivate communication and problem-solving abilities to effectively interpret data and convey insights.
- Stay Updated with Industry Trends: Regularly follow industry blogs, attend webinars, and participate in forums to keep abreast of the latest developments in data analysis.
What are the Real-world Applications of Data Analytics?
Data analytics plays a pivotal role across various sectors, enabling informed decision-making and operational efficiency. Key applications include:
- Healthcare: Data analytics enhances patient care by enabling early disease detection, predictive diagnostics, and personalized treatment plans. By analyzing vast medical datasets, it helps healthcare providers identify risk factors, improve operational efficiency, and optimize resource allocation for better patient outcomes.
- Finance: Data analytics strengthens financial security by assessing risks, detecting fraudulent activities, and refining investment strategies. By analyzing transaction patterns and market fluctuations, it provides insights for informed decision-making, enhances regulatory compliance, and optimizes portfolio management for improved financial stability and profitability.
- Retail: Retailers use data analytics to optimize inventory management, streamline supply chains, and personalize marketing strategies. By understanding customer preferences and purchasing behaviors, businesses predict demand, improve customer experiences, and increase sales through targeted promotions and dynamic pricing strategies.
- Manufacturing: Data analytics boosts manufacturing efficiency by monitoring equipment performance, predicting maintenance needs, and improving quality control. By leveraging real-time data, manufacturers reduce downtime, minimize production costs, and enhance productivity, ensuring higher output and superior product reliability in competitive markets.
- Energy: The energy sector benefits from data analytics by optimizing power distribution, forecasting energy demand, and integrating renewable sources. By analyzing consumption trends, companies enhance grid efficiency, minimize wastage, and develop sustainable energy solutions to meet the increasing global demand.
What Steps Should I Take to Advance My Data Analysis Career?
Advancing your data analysis career involves a strategic approach to skill development and professional growth. Here are six steps to guide you:
- Enhance Technical Proficiency: Deepen your understanding of programming languages like Python or R, and master data manipulation and visualization tools.
- Specialize in a Domain: Focus on a specific industry or area, such as finance, healthcare, or e-commerce, to apply data science techniques effectively within that context.
- Engage in Continuous Learning: Stay updated with the latest trends and technologies by enrolling in advanced courses, attending workshops, and obtaining relevant certifications.
- Build a Robust Portfolio: Develop and showcase projects that demonstrate your ability to solve real-world problems, highlighting your practical experience and expertise.
- Network with Professionals: Join data science communities, attend industry conferences, and participate in forums to connect with peers and mentors.
- Develop Soft Skills: Cultivate communication, teamwork, and problem-solving abilities to effectively collaborate with stakeholders and convey complex insights.
By following these steps, you can strategically advance your career in data analysis.
Must Read the article:
- Top IT Courses in Bangalore
- Top IT Courses in Pune
- Top IT Courses in Hyderabad
- Top IT Courses in Chennai
Mastering Python data analysis is a crucial step toward a successful career in data analysis. Unlike Excel and Power BI, which are primarily designed for specific tasks, Python offers unparalleled flexibility and scalability, enabling complex data manipulations, automation, and integration with various data sources. Its extensive libraries, such as Pandas for data manipulation, Matplotlib for visualization, and scikit-learn for machine learning, provide comprehensive tools for every data analysis stage.
Enrolling in a offline Python course in Bangalore and India’s top cities like Chennai, Pune, Hyderabad, Ahmedabad, Coimbatore, Delhi, Jaipur and Mumbai provides greater exposure, industry connections, and better job opportunities in the growing tech landscape, ensuring a strong foundation for a successful career in data analysis and software development. Mastering Python equips aspiring data scientists with the essential skills required to navigate and excel in the evolving landscape of data science.
DataMites Institute stands out as a top choice, offering a comprehensive suite of programs tailored to the evolving demands of the tech industry. The offerings include Data Science, Artificial Intelligence, Machine Learning, Python Programming, Data Analytics, and Deep Learning.
DataMites Institute stands out by offering practical, job-oriented training in data science and analytics. Their curriculum aligns with industry requirements, featuring live training sessions, real-world projects, and internships under experienced mentors. To accommodate diverse learning preferences, DataMites Training Institute provides both online and offline training options in multiple cities. DataMites provides offline Python courses in Pune, Chennai, Hyderabad, and Bangalore, Ahmedabad, Jaipur, Coimbatore, Delhi, Mumbai, catering to diverse learning preferences.
Datamites Institute credibility is reinforced by certifications from esteemed organizations like IABAC and NASSCOM FutureSkills, ensuring adherence to global standards. With a community exceeding 50,000 learners, DataMites fosters a collaborative educational environment. Additionally, their intensive BootCamp programs accelerate learning, equipping students with the necessary skills to thrive in today's competitive IT landscape.