A Comprehensive Guide on the Data Science Lifecycle
In an era where data is likened to oil, understanding the Data Science Lifecycle is akin to mastering the art of refining this valuable resource. This comprehensive guide delves into the intricate journey of data science - a fusion of statistics, algorithmic development, and technology - transforming raw data into actionable insights. It's a voyage from identifying the right questions to deploying impactful solutions, influencing everything from business strategies to technological innovations.
As we unpack each stage of this lifecycle, we not only explore the technicalities but also the profound impact and ethical considerations of wielding data's power. This exploration is not just about understanding a process; it's about envisioning the future sculpted by data-driven decisions.
Understanding the Data Science Lifecycle and Its Importance
Data Science is an interdisciplinary field that involves the use of various techniques, algorithms, processes, and systems to extract valuable insights and knowledge from data. It combines elements of statistics, computer science, domain expertise, and data engineering to analyze and interpret data for informed decision-making and predictive modeling.
Echoing the importance and growing demand for professionals in this field, the World Economic Forum's "Future of Jobs Report 2020" projected a striking trend. By 2025, it highlighted, data analysts and scientists are expected to become the most in-demand professions across industries. This projection underscores the pivotal role data science plays in the future of employment, marking it as a key driver of job creation in the global economy.
Importance of the Data Science Lifecycle:
The Data Science Lifecycle is crucial because it provides a structured approach to managing data-related projects, ensuring that they are efficient, effective, and aligned with business objectives. It offers several key benefits:
- Systematic Approach: The lifecycle guides data scientists and analysts through a well-defined process, helping them stay organized and focused on achieving project goals.
- Quality Assurance: It emphasizes data quality, validation, and preprocessing, ensuring that the insights derived are accurate and reliable.
- Iterative Process: The lifecycle is iterative, allowing for continuous improvement and refinement of models and analyses based on new data and insights.
- Business Alignment: By understanding the lifecycle, organizations can better align data science projects with their strategic goals, leading to more impactful results.
- Resource Optimization: It helps in efficient allocation of resources, reducing the risk of wasted time and effort on irrelevant or unproductive tasks.
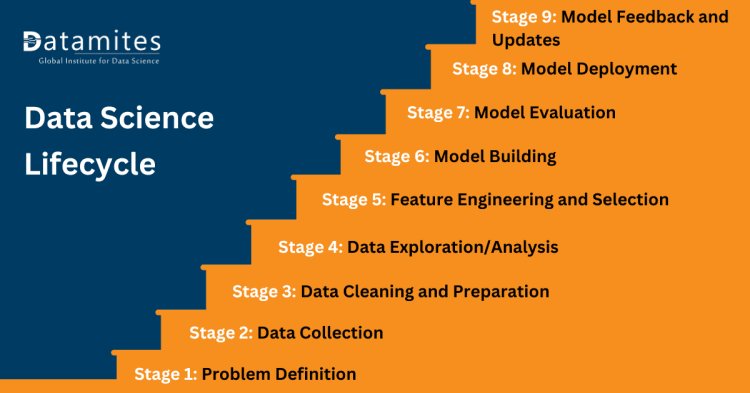
In the next section, we will delve into the various stages of the Data Science Lifecycle. These stages typically include problem formulation, data collection, data preparation, data exploration, model development, model evaluation, deployment, and maintenance. Each stage plays a critical role in the overall success of a data science project, and understanding them in detail is essential for data scientists and organizations aiming to harness the power of data effectively.
Stage 1: Problem Definition
In the Data Science Lifecycle, the first and arguably the most crucial stage is problem definition. This phase establishes the groundwork for the entire project and influences its outcome. Let's explore the key aspects of this stage:
Identifying the Business Problem:
Before diving into data analysis, it's essential to identify a specific business problem or opportunity that data science can address. This problem should be well-defined, clear, and relevant to the organization's goals. Identifying the right problem ensures that resources are allocated efficiently, and the project has a meaningful impact on the business.
Understanding Stakeholder Requirements:
To define the problem accurately, data scientists need to collaborate closely with stakeholders, including business leaders, domain experts, and end-users. Gathering input from these parties helps in understanding their requirements, expectations, and the context in which the problem exists. It ensures that the data science solution aligns with the organization's needs.
Setting Clear Objectives:
Once the problem is identified and stakeholder requirements are understood, it's crucial to set clear and measurable objectives for the data science project. Objectives should be specific, achievable, and time-bound (SMART criteria). These objectives will serve as the guiding principles throughout the project and help in evaluating its success.
Importance of Defining the Problem:
Defining the problem correctly is of utmost importance for several reasons:
- Focus: It keeps the project focused on solving a particular issue rather than aimlessly exploring data, ensuring that efforts are not wasted on irrelevant analyses.
- Alignment: Proper problem definition aligns the data science project with the organization's strategic goals, ensuring that it contributes meaningfully to the business.
- Resource Efficiency: It helps in efficient allocation of resources, including time, budget, and personnel, as they are directed towards solving the identified problem.
- Measurability: Clear objectives allow for the measurement of success, making it easier to assess whether the project delivers the desired outcomes.
- Stakeholder Engagement: Involving stakeholders in the problem definition process fosters collaboration, transparency, and a shared understanding of project goals.
Read these articles:
Stage 2: Data Collection
In the Data Science Lifecycle, the second stage is Data Collection. This stage involves gathering the necessary data from various sources to address the defined business problem. Here are the key considerations and aspects of this stage:
Sources of Data (Internal & External):
- Internal Data Sources: These sources include data generated and stored within the organization, such as customer records, sales transactions, employee data, and operational logs. Internal data is often structured and readily accessible.
- External Data Sources: External data comes from sources outside the organization. It can include publicly available data, third-party datasets, social media feeds, and more. External data can provide valuable insights and context but may require additional effort to acquire and integrate.
Techniques for Data Collection:
Data can be collected through various techniques, including:
- Surveys and Questionnaires: Gathering data directly from individuals or groups through surveys and questionnaires to capture opinions, preferences, and feedback.
- Web Scraping: Extracting data from websites and online sources, often used for gathering information like news articles, product prices, or social media content.
- APIs (Application Programming Interfaces): Accessing data from web services and platforms using APIs, which provide structured and real-time data.
- IoT Devices: Collecting data from Internet of Things (IoT) devices, sensors, and equipment, enabling the monitoring of physical processes and environments.
- Database Queries: Retrieving data from internal databases using SQL queries or other database management tools.
Ensuring Data Quality and Integrity:
Maintaining data quality and integrity is crucial to the success of any data science project. It involves:
- Data Cleaning: Identifying and correcting errors, inconsistencies, and missing values in the dataset to ensure accuracy.
- Data Validation: Checking data against predefined rules to ensure it meets quality standards and is fit for analysis.
- Data Integration: Combining data from multiple sources, ensuring consistency and compatibility.
- Data Privacy and Security: Implementing measures to protect sensitive or private information, in compliance with data protection regulations.
Challenges in Data Collection:
Data collection can be a complex and challenging process due to various reasons:
- Data Availability: Some data may not be readily accessible, especially external data sources that require permission, licensing, or payment.
- Data Volume: Managing and processing large volumes of data can be resource-intensive and may require specialized tools and infrastructure.
- Data Quality: Ensuring data accuracy, completeness, and consistency can be challenging, as data may be noisy or contain errors.
- Data Privacy: Adhering to data privacy regulations (e.g., GDPR, HIPAA) and protecting sensitive information adds complexity to data collection.
- Data Bias: Bias in data collection methods or sources can lead to biased models and results, which can have ethical and fairness implications.
Stage 3: Data Cleaning and Preparation
The Data Cleaning and Preparation stage is a critical phase in the Data Science Lifecycle, following data collection. This stage focuses on refining and structuring the data to make it suitable for analysis and modeling. Here are the key aspects of this stage:
Importance of Data Cleaning:
- Data Accuracy: Cleaning helps ensure that the data is accurate by identifying and rectifying errors, inconsistencies, and inaccuracies in the dataset.
- Reliability: Clean data is more reliable, leading to trustworthy insights and models. It reduces the likelihood of making incorrect conclusions based on flawed data.
- Consistency: Data cleaning ensures that data is consistent across different sources and over time, improving the reliability of analyses and models.
- Enhanced Performance: Clean data leads to more efficient and accurate machine learning algorithms and statistical analyses, resulting in better predictive models and insights.
Techniques for Handling Missing Data and Outliers:
Missing Data Handling:
- Imputation: Replace missing values with estimates (e.g., mean, median, mode) based on the available data.
- Deletion: Remove rows or columns with a significant amount of missing data, if it doesn't lead to data loss.
- Advanced Techniques: Leverage machine learning algorithms to anticipate absent values utilizing other features.
Outlier Handling:
- Detection: Identify outliers using statistical methods (e.g., z-scores, IQR), visualization, or machine learning techniques.
- Transformation: Transform data (e.g., logarithmic or Box-Cox) to reduce the impact of outliers.
- Capping: Replace extreme outliers with predefined thresholds to limit their influence.
Data Transformation and Normalization:
Data Transformation:
- Feature Engineering: Create new features that may be more informative for the problem at hand.
- Encoding Categorical Data: Convert categorical variables into numerical representations (e.g., one-hot encoding, label encoding).
- Scaling: Rescale numerical features to a common range to prevent some features from dominating others.
Normalization:
- Min-Max Scaling: Scale data to a specified range, typically between 0 and 1.
- Z-Score Normalization: Standardize the data to achieve a mean of 0 and a standard deviation of 1.
- Robust Scaling: Scale data based on percentiles, making it less sensitive to outliers.
Tools and Software Commonly Used:
Several tools and software are commonly used for data cleaning and preparation:
- Python Libraries: Python offers a wide range of libraries for data cleaning and preparation, including Pandas for data manipulation, NumPy for numerical operations, and Scikit-learn for preprocessing tasks.
- R: R is another popular programming language for data analysis, with packages like dplyr and tidyr for data manipulation and cleansing.
- OpenRefine: An open-source tool for data cleaning and transformation, particularly useful for handling messy data.
- Excel: Excel is often used for basic data cleaning tasks, such as removing duplicates, filling missing values, and basic transformations.
- Commercial Tools: Commercial data preparation platforms like Trifacta and Alteryx offer advanced features and visual interfaces for data cleansing and transformation.
Stage 4: Data Exploration/Analysis
The Data Exploration/Analysis stage is a pivotal phase in the Data Science Lifecycle, where data scientists delve into the dataset to gain a deeper understanding of its characteristics, uncover patterns, and generate insights. Here are the fundamental elements of this phase:
Exploratory Data Analysis (EDA) Techniques:
- Summary Statistics: Calculate basic statistics such as mean, median, standard deviation, and percentiles to describe the central tendencies and spread of the data.
- Data Visualization: Create visual representations of the data using charts and graphs, including histograms, scatter plots, bar charts, and box plots, to reveal patterns and trends.
- Correlation Analysis: Examine relationships between variables by calculating correlation coefficients (e.g., Pearson's, Spearman's) to identify dependencies.
- Dimensionality Reduction: Techniques like Principal Component Analysis (PCA) can help reduce the dimensionality of the dataset while preserving important information.
- Cluster Analysis: Identify clusters or groups within the data using clustering algorithms like K-means or hierarchical clustering.
- Time Series Analysis: If dealing with time-series data, time-based EDA techniques like autocorrelation and seasonal decomposition can be applied.
Statistical Analysis and Visualization:
- Hypothesis Testing: Conduct hypothesis tests (e.g., t-tests, chi-squared tests) to determine if observed differences or relationships in the data are statistically significant.
- ANOVA (Analysis of Variance): Use ANOVA to analyze variations between groups or categories in the dataset.
- Regression Analysis: Perform regression analysis to model relationships between dependent and independent variables, enabling predictions and inference.
- Heatmaps: Visualize correlation matrices using heatmaps to identify patterns and relationships between variables.
- Time Series Plots: Create time series plots to visualize trends, seasonality, and anomalies in time-dependent data.
Deriving Insights from Data:
- Pattern Recognition: Identify recurring patterns and trends in the data that provide insights into underlying phenomena.
- Anomaly Detection: Detect outliers or anomalies that may indicate errors or unusual events.
- Causal Inference: Explore potential cause-and-effect relationships between variables, although establishing causality often requires more rigorous experimentation.
- Business Insights: Translate data findings into actionable insights that can inform decision-making and drive business value.
Tools Used for Data Exploration:
- Python Libraries: Pandas, Matplotlib, Seaborn, Plotly, and Altair are popular Python libraries for data manipulation, visualization, and statistical analysis.
- R: R provides a rich ecosystem of packages for data exploration and visualization, including ggplot2, dplyr, and tidyr.
- Jupyter Notebooks: Jupyter notebooks allow data scientists to create interactive documents that combine code, visualizations, and narrative explanations.
- Tableau: Tableau is a commonly utilized data visualization tool renowned for its intuitive interface, facilitating the creation of interactive dashboards.
- Power BI: Microsoft Power BI is another popular business intelligence tool for data exploration and visualization.
- Excel: Excel remains a common choice for basic data exploration and visualization tasks.
Stage 5: Feature Engineering and Selection
In the Data Science Lifecycle, the Feature Engineering and Selection stage is crucial for preparing the data for model building. This stage involves creating new features, selecting the most relevant ones, and optimizing the feature set to improve model performance. These are the fundamental elements of this phase:
Understanding Feature Engineering:
- Feature Creation: Feature engineering entails generating novel features from available data to more accurately depict the underlying patterns. This may encompass mathematical conversions, aggregations, or domain-specific insights.
- Feature Transformation: Modifying features can enhance their compatibility for modeling purposes. Methods include scaling, normalization, and encoding categorical variables.
- Feature Extraction: Feature extraction techniques, such as Principal Component Analysis (PCA) or dimensionality reduction methods, aim to capture the most important information in the data while reducing dimensionality.
Techniques for Feature Selection and Extraction:
- Filter Methods: These methods assess feature relevance independently of the machine learning algorithm. Common techniques include correlation analysis and statistical tests (e.g., chi-squared, ANOVA).
- Wrapper Methods: Wrapper methods evaluate feature subsets by training and testing models on different combinations of features. Approaches such as forward selection, backward elimination, and recursive feature elimination are classified under this category.
- Embedded Methods: Embedded methods integrate feature selection directly into the model training process. For instance, decision trees and random forests can evaluate feature importance while being trained.
- Dimensionality Reduction: Techniques like Principal Component Analysis (PCA) and t-distributed Stochastic Neighbor Embedding (t-SNE) reduce the dimensionality of the feature space while retaining relevant information.
Impact of Feature Engineering on Model Performance:
- Improved Model Accuracy: Well-engineered features can lead to more accurate and effective machine learning models. They can capture hidden patterns and reduce noise in the data.
- Faster Model Training: Reducing the number of features through selection or extraction can significantly speed up model training, especially for algorithms that are sensitive to dimensionality.
- Reduced Overfitting: Carefully engineered features can help prevent overfitting by providing the model with relevant information while eliminating noise and irrelevant details.
- Interpretability: Feature engineering can also enhance model interpretability, as meaningful features are easier to explain to stakeholders.
- Resource Efficiency: Models with fewer, more informative features require less computational resources for deployment and maintenance.
Refer to these articles:
- Data Science Career Scope in India
- What would be the Data Science Course Fee in India?
- Data Scientist Salary in India
Stage 6: Model Building
The Model Building stage in the Data Science Lifecycle involves selecting appropriate algorithms, building and training models, and evaluating their performance. Here are the key considerations in this stage:
Choosing the Right Algorithms:
- Algorithm Selection: The choice of algorithms depends on the nature of the problem, the type of data, and the desired outcomes. Common algorithms include linear regression, decision trees, random forests, support vector machines, neural networks, and more.
- Ensemble Methods: Ensemble techniques like bagging, boosting, and stacking can be employed to combine multiple models for improved predictive performance.
- Deep Learning: For tasks involving complex patterns in large datasets, deep learning algorithms such as convolutional neural networks (CNNs) and recurrent neural networks (RNNs) may be appropriate.
- Domain Expertise: Consider domain-specific knowledge when selecting algorithms. Certain algorithms may be better suited to specific industries or applications.
Building and Training Models:
- Data Splitting: Split the dataset into training, validation, and test sets to ensure that the model is trained on one subset, validated on another, and tested on a separate, unseen subset.
- Model Training: Train the chosen algorithms on the training data using appropriate parameters and hyperparameters. This involves iterative optimization to minimize a chosen performance metric (e.g., mean squared error for regression, accuracy for classification).
- Hyperparameter Tuning: Refine model performance by adjusting hyperparameters, such as learning rate and regularization strength. Employ techniques like grid search or random search for optimization.
Techniques for Model Validation:
- Cross-Validation: Utilize methods such as k-fold cross-validation to evaluate model performance. Cross-validation aids in assessing the model's ability to generalize to new, unseen data.
- Performance Metrics: Use appropriate evaluation metrics, such as accuracy, precision, recall, F1-score, or mean squared error, depending on the problem type (classification or regression).
- Visualization: Visualize model performance with techniques like ROC curves, confusion matrices, and learning curves to gain insights into model behavior.
Overfitting vs. Underfitting:
- Overfitting: Overfitting transpires when a model tightly fits the training data, capturing noise and outliers.Models that overfit demonstrate strong performance on training data but exhibit poor results when applied to unseen data.
- Underfitting: Underfitting happens when a model is too simplistic to capture the inherent patterns in the data. Models experiencing underfitting demonstrate poor performance on both training and validation data.
- Balancing Act: Model building involves finding a balance between overfitting and underfitting by adjusting the model's complexity and regularization techniques.
Stage 7: Model Evaluation
The Model Evaluation stage is crucial for assessing the performance of the machine learning models built in the previous stage. It involves using appropriate evaluation metrics, cross-validation techniques, and strategies for improving model performance. Here are the fundamental elements of this phase:
Evaluation Metrics for Different Types of Models:
Classification Models:
- Accuracy assesses the overall accuracy of the model's predictions.
- Precision denotes the ratio of true positive predictions to all positive predictions.
- Recall (Sensitivity) quantifies the proportion of correctly identified true positives.
- F1-Score: Harmonic mean of precision and recall, useful when balancing precision and recall is important.
- ROC Curve and AUC: Assess the model's ability to distinguish between classes, particularly in imbalanced datasets.
Regression Models:
- Mean Absolute Error (MAE): Calculates the mean absolute difference between predicted and actual values.
- Mean Squared Error (MSE): Calculates the mean squared difference between predicted and actual values.
- Root Mean Squared Error (RMSE): The square root of MSE, giving a more interpretable error metric.
- R-squared (R²): Quantifies the percentage of variance accounted for by the model.
Clustering Models:
- Silhouette Score: Measures the quality of clustering based on the distance between clusters and within clusters.
- Inertia (Within-cluster Sum of Squares): Measures the compactness of clusters, lower values indicate better clustering.
Cross-Validation Techniques:
Cross-validation is crucial for robust model evaluation and aids in estimating the model's generalization to unseen data. Typical cross-validation techniques include:
- K-Fold Cross-Validation: The dataset is divided into k subsets (folds), and the model is trained and tested k times, using a different fold for testing in each iteration.
- Stratified Cross-Validation: Used for imbalanced datasets, it ensures that each fold has a proportional representation of each class.
- Leave-One-Out Cross-Validation (LOOCV): Each data point is treated as a single fold, resulting in n iterations for a dataset with n samples.
- Time Series Cross-Validation: For time-series data, it preserves chronological order during cross-validation by using expanding or rolling windows.
Model Performance Improvement Strategies:
- Hyperparameter Tuning: Fine-tune model hyperparameters to optimize performance. Methods such as grid search and random search can be utilized.
- Feature Engineering: Continuously refine and engineer features to improve model input data.
- Ensemble Methods: Combine multiple models (e.g., bagging, boosting, stacking) to leverage their strengths and mitigate weaknesses.
- Regularization: Implement regularization techniques such as L1 (Lasso) or L2 (Ridge) regularization to mitigate overfitting.
- Feature Selection: Use feature selection techniques to focus on the most informative features and reduce noise.
- Data Augmentation: For certain tasks like image classification, create additional training data by applying transformations to the existing dataset.
- Advanced Models: Explore more complex or ensemble models when simpler models don't suffice, such as deep learning architectures or gradient-boosted trees.
- Model Interpretability: Gain insights into model predictions through techniques like SHAP values, feature importance scores, or local interpretability methods.
Stage 8: Model Deployment
The Model Deployment stage marks the transition from model development to putting machine learning models into production, where they can be used to make predictions on new data. This stage involves various strategies, tools, and considerations for deploying, monitoring, and maintaining deployed models effectively.
Deployment Strategies:
- Cloud Services: Cloud platforms such as AWS, Azure, and Google Cloud offer managed machine learning services and infrastructure for deploying models quickly and efficiently.
- Containerization: Using containerization technologies like Docker and Kubernetes allows for consistent and scalable deployment across different environments.
- Serverless Computing: Serverless platforms like AWS Lambda and Azure Functions enable automatic scaling and cost-effective deployment of machine learning inference services.
- On-Premises Deployment: In some cases, models may need to be deployed on on-premises servers or edge devices for data privacy, security, or latency reasons.
- API Endpoints: Expose models as RESTful APIs or web services, allowing other applications to make predictions by sending HTTP requests.
Tools and Technologies for Model Deployment:
- Docker: Containerization technology for packaging models and their dependencies into containers for deployment.
- Kubernetes: Container orchestration platform for managing containerized applications and scaling them as needed.
- Flask, FastAPI: Web frameworks that facilitate building RESTful APIs for model deployment.
- TensorFlow Serving, ONNX Runtime: Frameworks designed for serving machine learning models efficiently in production.
- Apache Kafka, RabbitMQ: Message brokers that enable real-time data ingestion and model inference.
- Model Versioning Tools: Tools like MLflow and DVC help manage and version models for reproducibility.
- Monitoring Tools: Tools like Prometheus and Grafana can be used to monitor model performance and infrastructure health.
Monitoring and Maintaining Deployed Models:
- Performance Monitoring: Continuously monitor the model's performance by tracking key metrics, such as prediction accuracy, latency, and resource utilization.
- Data Drift Detection: Implement data drift detection mechanisms to identify changes in the distribution of incoming data that may affect model performance.
- Model Retraining: Set up processes to periodically retrain models with fresh data to keep them up-to-date and maintain their predictive accuracy.
- Security Measures: Implement security measures to protect models and data, including encryption, access controls, and threat detection.
- Scaling and Resource Management: Ensure the deployed model can handle varying workloads by scaling resources appropriately, using auto-scaling mechanisms.
- Versioning and Rollback: Maintain version control of models and have a rollback plan in case a new model version exhibits unexpected behavior.
- Documentation: Maintain clear documentation for the deployed model, including input/output specifications, dependencies, and usage guidelines.
- Alerting and Incident Response: Set up alerting systems to notify stakeholders of issues and establish incident response procedures for model failures.
- Feedback Loop: Establish a feedback loop with end-users and stakeholders to collect feedback and continuously improve the model.
Read the following articles:
- Data Science Course Fee in Bangalore
- Data Science Course Fee in Pune
- Data Science Course Fee in Hyderabad
Stage 9: Model Feedback and Updates
The Model Feedback and Updates stage is an iterative phase within the Data Science Lifecycle, concentrating on gathering feedback regarding model performance, implementing essential enhancements, and consistently refining the model. Here are the principal components of this stage:
Collecting Feedback on Model Performance:
- User Feedback: Gather feedback from end-users and stakeholders who interact with the model in real-world applications. Their insights and observations can provide valuable information about the model's behavior and limitations.
- Monitoring Metrics: Continuously monitor key performance metrics, such as accuracy, precision, recall, and F1-score, to assess how well the model is performing over time.
- Data Drift Detection: Implement mechanisms to detect changes in the data distribution, as data drift can impact model performance. If data drift is detected, investigate its causes and adapt the model accordingly.
- Usage Analytics: Analyze how the model is being used, including the frequency and types of predictions made, to understand its impact on the business and identify areas for improvement.
Iterative Process for Model Improvement:
- Retraining: Periodically retrain the model using fresh and updated data. This ensures that the model remains accurate and relevant in changing environments.
- Feature Engineering: Continue to refine and engineer features to improve the model's input data. Incorporate new data sources or variables that can enhance predictive power.
- Hyperparameter Tuning: Fine-tune hyperparameters to optimize model performance. This process can involve experimentation and exploration to find the best configurations.
- Model Selection: Consider alternative models or algorithms if the current model is not meeting performance expectations. Explore whether different approaches can yield better results.
- Ensemble Methods: If applicable, explore ensemble techniques to combine the strengths of multiple models and improve overall prediction accuracy.
Best Practices for Continuous Model Enhancement:
- Documentation: Maintain clear documentation of model updates, including the reasons for changes, performance improvements, and any issues addressed.
- Version Control: Use version control to keep track of model versions, data, and code changes, ensuring reproducibility and traceability.
- Testing: Implement rigorous testing procedures to verify that model updates do not introduce new bugs or issues.
- Deployment Strategy: Plan for a smooth transition when deploying updated models, ensuring minimal disruption to existing processes.
- Feedback Loop: Establish a structured feedback loop with end-users and stakeholders to regularly gather insights and suggestions for improvement.
- Model Governance: Implement model governance practices to maintain control over model updates, access, and compliance with regulations.
- Automated Pipelines: Whenever possible, automate the process of retraining and deploying updated models to reduce manual effort and human error.
- Monitoring and Alerting: Continuously monitor model performance and set up alerting mechanisms to detect issues promptly.
- Ethical Considerations: Assess the ethical implications of model updates, including potential biases or fairness issues, and take steps to mitigate them.
In this exploration of the Data Science Lifecycle, we've covered the various stages that data scientists and analysts follow to effectively harness data and create valuable insights. Let's recap the key stages and discuss the importance of a systematic approach in data science, as well as some future trends and evolutions in data science methodologies.
Data Science Trends for the Future
The global data science platform market is poised for substantial growth, projected to surge from $81.47 billion in 2022 to an impressive $484.17 billion by 2029. This forecast, boasting a robust Compound Annual Growth Rate (CAGR) of 29.0%, comes from Fortune Business Insights. As the field of data science rapidly evolves, numerous trends are shaping its future.
- Automated Machine Learning (AutoML): Automation of model selection, hyperparameter tuning, and feature engineering to make data science more accessible.
- Explainable AI (XAI): Increased focus on understanding and interpreting complex machine learning models to enhance transparency and trust.
- AI Ethics and Bias Mitigation: Growing awareness and efforts to address ethical concerns and biases in machine learning algorithms.
- Federated Learning: Collaborative and privacy-preserving machine learning approaches that allow model training on decentralized data.
- DataOps and MLOps: Streamlining the process of deploying and managing machine learning models in production.
- Quantum Computing: The potential for quantum computing to revolutionize data analysis, solving complex problems at unprecedented speeds.
The Data Science Lifecycle, essential in meeting the growing demand for data-driven insights, provides a systematic journey from problem definition to model deployment. Its significance lies in ensuring efficiency, accuracy, and alignment with business goals. As data science advances, key trends like AutoML, XAI, ethics, and quantum computing shape its future. A structured approach remains crucial, promoting transparency, trust, and continuous model improvement. With high-demand for data science, the Data Science Lifecycle stands as a vital framework for unlocking valuable insights and making informed decisions.
DataMites is offering specialized data science training, including a Certified Data Scientist Courses. This program is career-oriented, designed to equip learners with the necessary skills and knowledge to thrive in the field of data science. It covers various aspects of the Data Science Lifecycle, ensuring students are well-versed in both the foundational and advanced concepts of data science. Significantly, these courses come with prestigious IABAC® (International Association of Business Analytics Certification) and NASSCOM® Certification, adding valuable recognition to the qualifications of the learners and enhancing their professional credibility in the data science community.