A Comprehensive Guide to K-Nearest Neighbor (KNN) Algorithm in Python

K- Nearest Neighbor is one of the simplest supervised Machine Learning techniques which can solve both classification (categorical/discrete target variables) and regression (Continuous target variable) problems. It is a non-parametric algorithm as it does not make any assumptions about the distribution of data.
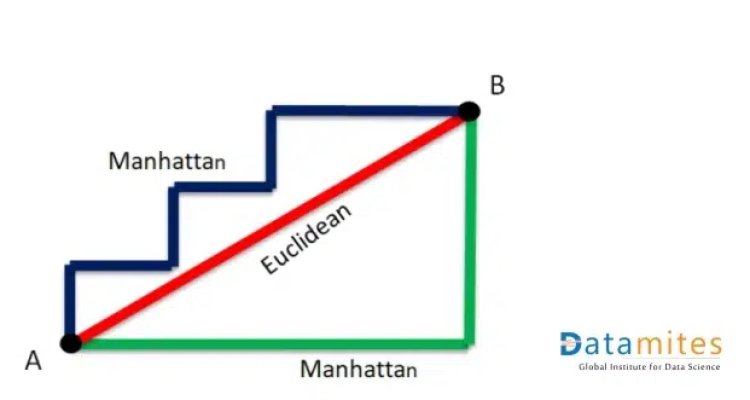
As per the name of the algorithm, it uses the K number of its nearest data points to predict the target variable (dependent variable) for a new set of input data. It uses distance metrics for finding the nearest neighbors. The most commonly used distance metrics are Euclidean distance and Manhattan distance.
Refer this article : Theoretical approach to PCA with python implementation
Introduction to Euclidean distance and Manhattan distance:
How does KNN work?
Let’s understand the working of the KNN algorithm with an example.
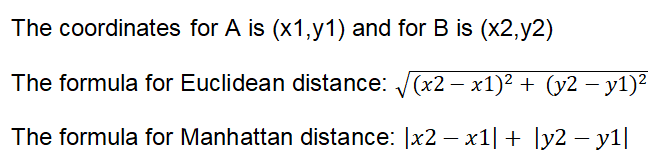
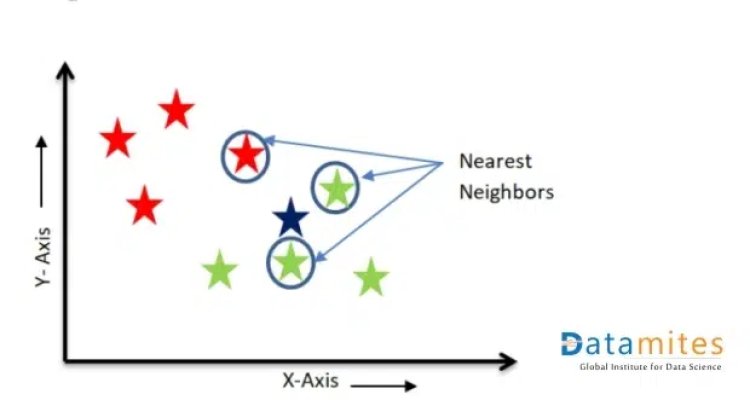
Assume that we have a training dataset that has 2 categories in its target variable – Red star and Green star. We have plotted the data points in the 2-D plane. We have a new data point- A blue star for which we have to predict the category.
We can see that it belongs to the Green star category as its nearest neighbors are of the Green star category.
This is the concept behind the KNN algorithm. It takes the help of the nearest neighbors to find out the category of the test data point.
The steps involved in the KNN algorithm are as follows:
- Select k i.e. number of nearest neighbors. Assume K=3 in our example.
- Find the Euclidean distance between each of the training data points (all red Stars and green stars) and the new data point (Blue star).
- Find K number of nearest neighbors based on the distance calculated as nearest neighbors are those data points that have minimum distance in feature space from our new data point.
- For Classification: Label the new data point based on the majority of classes present in the selected neighbors (the majority vote method is used to find the category of the new data point). In the above figure, 2 green stars and 1 red star are the nearest neighbors of the Blue star. The majority is a Green star, so the blue star will be considered under the green star category.
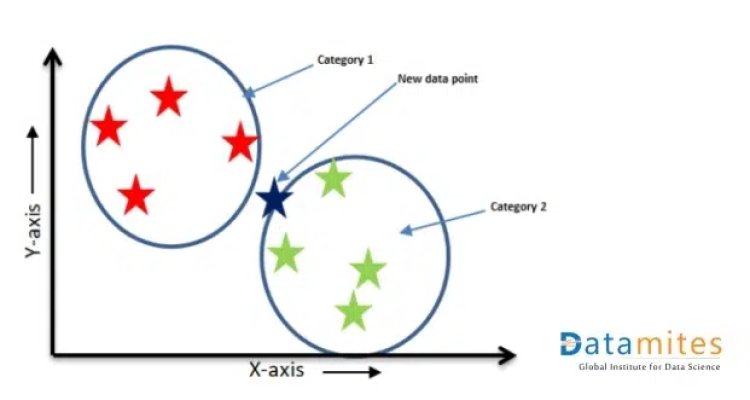
- For Regression: the mean or median of the k nearest neighbors is taken to make a prediction about the new data point. In our example, the 3 Red stars inside the circle are the nearest neighbors of the Blue Star. The value of the Blue star will be the mean/average value of 3 Red Stars in the circle.
For Regression
For Classification
Read this article to know: A Complete Guide to Naive Bayes Algorithm in Python
Why KNN is called a Lazy Algorithm?
KNN is known as a lazy learner because it doesn’t do any calculations or computations when the training data is provided to it. Instead, it just stores the data during that time. It doesn’t build a model until a query is performed on the dataset. When we provide the test data point, it starts calculating the distance and finds the nearest neighbors.
How to choose k?
The performance of KNN algorithm is highly affected by the value of K. The value of K can be selected using the Error curve method. In this method, a graph is plotted between the error rate and K. Error is calculated for a range of K values. The value of K for which the error is minimum will be considered as the final value of K.
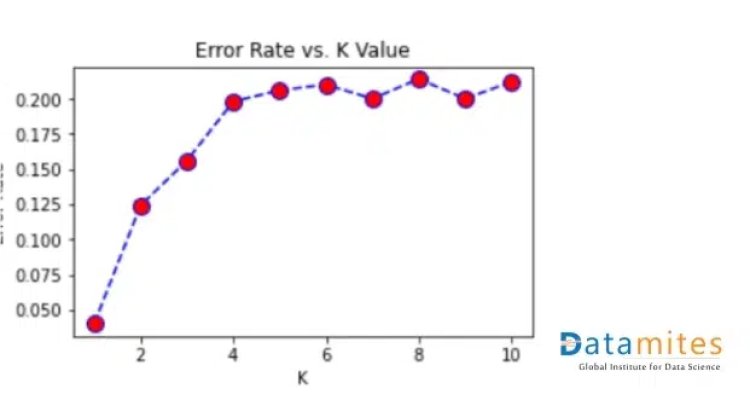
There will be the problem of overfitting if a small value of K is chosen. For K=1, the error is always zero. The training error will be less and the test error will be more. As we increase the value of K, test error will reduce. But after a certain K value, underfitting is introduced and test error goes high. Thus it is very important to select the optimum value for K.
K value can also be decided using domain knowledge.
Important Points
- It is recommended to select the value of K as an odd number, especially in the case of binary classification.
- KNN is highly impacted by the outliers – If the new data point is near to the outlier, it will consider that outlier as the nearest neighbour and make predictions accordingly.
- KNN is also affected by an imbalanced dataset in case of classification problems. It will be biased by a high number of categories.
- Data Preprocessing is a very important step before using the KNN model (especially feature scaling, dimensionality reduction, handling imbalanced datasets and outlier treatment).
- KNN takes less time and cost while training time is expensive in the testing phase.
Refer this article to know : What is a Support Vector Machines(SVM) in Python?
Applications of KNN:
- In handling Missing values: – KNN is a widely used algorithm for imputing missing values in the dataset while using other ML algorithms for prediction.
- Recommendation Engines: KNN can help find users of similar characteristics; it can be used in recommendation systems. For example, it can be used in an online video streaming platform to suggest content a user is more likely to watch by analyzing what similar users watch.
- Finance: Bank-related sectors use KNN to predict credit card ratings or qualify loan applications.
Healthcare: Healthcare companies use the KNN algorithm to decide if a patient is vulnerable to certain diseases and conditions. - Pattern Recognition, video recognition, image recognition, and handwriting detection.
- SMOTE – A technique to handle an imbalanced dataset also uses KNN to make duplicate data points to form a balanced dataset.
KNN Algorithm Explained

Python Implementation
Use Case: To predict the quality of the seed
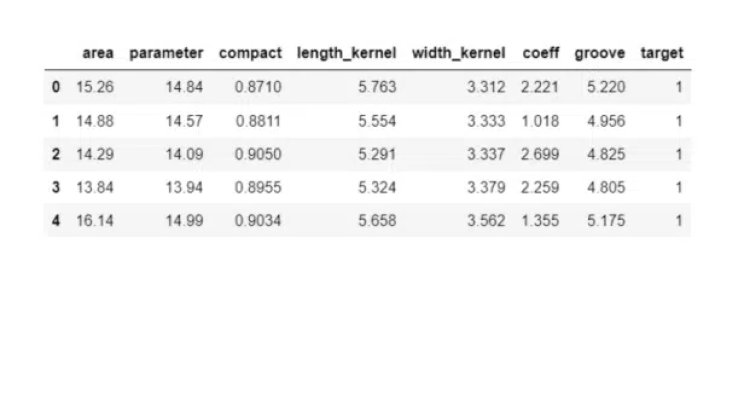
This is a classification problem, in which the model needs to predict the quality of the seed and whether it belongs to category 1, 2 or 3 based on other features like area, the parameter of seed, length and width of kernel etc. The target class has 3 labels – 1, 2 and 3. Therefore, we can say that it is a multi-class classification problem.
Step1: Import the necessary libraries
import pandas as pd
import numpy as np
from sklearn.neighbors import KNeighborsClassifier
from sklearn.preprocessing import StandardScaler
from sklearn.model_selection import train_test_split
from sklearn.metrics import accuracy_score, confusion_matrix,classification_report
import matplotlib.pyplot as plt
import seaborn as sns
import warnings
warnings.filterwarnings(‘ignore’)
Step 2: Load the dataset
seeds = pd.read_csv(“seeds.csv”)
seeds.head()
Also read: Support Vector Machine Algorithm (SVM) – Understanding Kernel Trick
Step 3: Perform Exploratory Data Analysis and Data Visualization
Step 4: Split the data into X and Y
X = seeds[[‘area’,’parameter’,’compact’,’length_kernel’,’width_kernel’,’coeff’,’groove’]]
y = seeds[‘target’]
Step 5: Splitting in Test and train part
X_train, X_test, y_train, y_test = train_test_split(X, y, random_state=0)
Step 6: Find the optimal value of K and plot the graph between K and the error rate.
#create a list to store the error values for each k
error_rate = []
for i in range(1,11):
knn = KNeighborsClassifier(n_neighbors=i)
knn.fit(X_train,y_train)
pred_i = knn.predict(X_test)
error_rate.append(np.mean(pred_i != y_test))
#Let us plot the k-value and error rate
plt.figure(figsize=(5,3))
plt.plot(range(1,11),error_rate,color=’blue’, linestyle=’dashed’, marker=’o’,markerfacecolor=’red’, markersize=10)
plt.title(‘Error Rate vs. K Value’)
plt.xlabel(‘K’)
plt.ylabel(‘Error Rate’)
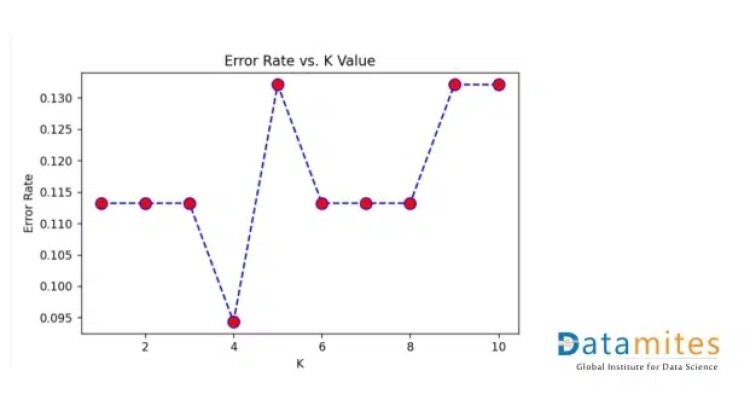
For the graph, we concluded that the optimal value of K is 4.
Step 7: Model Building
let’s fit the data into KNN model and see how well it performs:
knn = KNeighborsClassifier(n_neighbors=4)
knn.fit(X_train,y_train)
y_pred = knn.predict(X_test)
In this way, KNN predicts the category of the test data point.
In case of regression problem –
- Import KNN Regressor using from sklearn.neighbors import KNeighborsRegressor
- Can use RSME as error matric for finding the value of K
Find HCF using Function in Python
How to evaluate Model Performance
For Classification: Confusion Matrix, Precision, Recall, Accuracy, F1 scoreFor Regression: MSE, RMSE, R2 score, Adjusted R2
Step 8: Let us evaluate the model.
This is a classification task, so we will consider accuracy score, precision, recall, f1 score, and confusion matrix
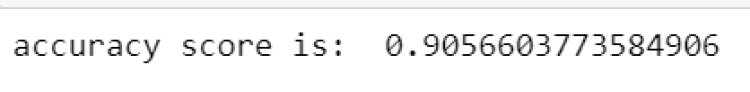
#Checking Accuracy score
print(“The accuracy score is : “, accuracy_score(y_test,y_pred))
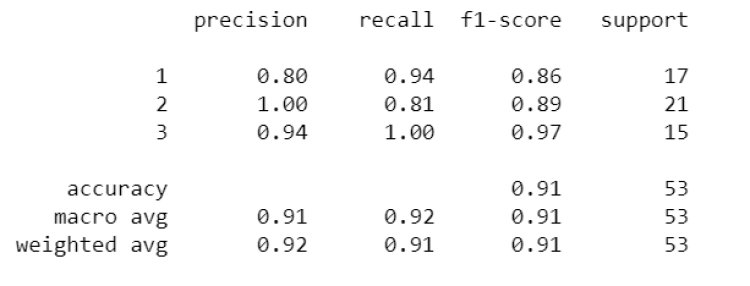
print(classification_report(y_test,y_pred))
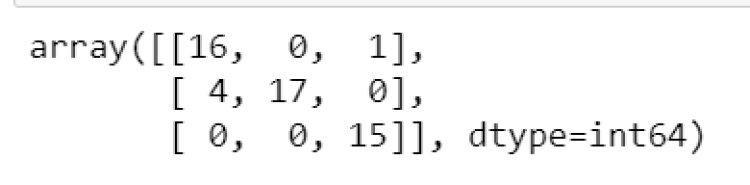
#Confusion matrix
from sklearn.metrics import confusion_matrix
confusion_matrix(y_test,y_pred)
Note: We need to perform other data preprocessing steps like balancing imbalanced datasets, changing categorical data into numerical data, outlier and missing value imputation, and feature selection (whatever is required according to the dataset) before using the algorithm.
Being a prominent data science institute, DataMites provides specialised training in topics including machine learning, deep learning, artificial intelligence, the internet of things. Our python Courses at DataMites have been authorised by the International Association for Business Analytics Certification (IABAC), a body with a strong reputation and high appreciation in the analytics field.
Nested For Loop in Python