Best Practices for Data Analysts in Data Visualization
In the era of big data, the ability to make sense of vast amounts of information is more critical than ever. Data visualization serves as a bridge between complex datasets and actionable insights, allowing data analysts to convey information in an understandable manner. It transforms raw data into visual representations, making patterns, trends, and anomalies easier to identify.
Visualizations play a pivotal role in data analytics. They not only help analysts interpret data effectively but also facilitate decision-making for stakeholders. As the demand for data-driven decision-making grows, understanding how to visualize data becomes an essential skill for anyone pursuing a career in data analytics. Whether through a Data Analytics course or a specialized Data Analytics certification course, acquiring these skills can significantly enhance your professional toolkit.
Importance of Data Visualization: Unlocking the Power of Data
Data visualization is not merely a tool; it's a powerful medium that translates complex data into comprehensible visuals. The benefits of effective data visualization extend beyond aesthetics; they include:
- Improved Comprehension: Visuals can convey complex information in a straightforward way, enabling faster understanding.
- Enhanced Decision-Making: Stakeholders can make informed decisions quickly when they grasp insights from visuals.
- Trend Recognition: Visualizations make it easier to spot trends over time, which is essential for strategic planning.
- Engagement: Interactive and visually appealing data presentations capture the audience's attention, making the data more relatable.
The importance of these benefits cannot be overstated, particularly in today's fast-paced business environment. Organizations that harness the power of data visualization can outpace their competitors by making faster, more informed decisions.
Types of Data Visualizations
Understanding the various types of data visualizations is fundamental for any data analyst. Each type serves a unique purpose and is suited for different data contexts. Here are some common types:
- Bar Charts: Helpful for comparing amounts among different categories.
- Line Graphs: Excellent for displaying trends over time.
- Pie Charts: Effective for illustrating proportions and percentages.
- Heat Maps: Useful for showing data density or variations across two dimensions.
- Scatter Plots: Ideal for showcasing relationships between two variables.
By selecting the appropriate visualization type, data analysts can present their findings in a way that resonates with their audience. A well-chosen visualization can dramatically improve comprehension and retention of information.
Refer these articles:
- Data Analytics Lifecycle: A Step-by-Step Guide
- Introduction to SQL for Data Analytics
- Role of Data Analytics in Business Decision Making
How Does Data Visualization Connect with Data Analysts?
Data visualization is at the heart of a data analyst's role. It serves as a primary means for analysts to communicate their findings and insights to stakeholders. In a Data Analytics training program, students learn not just how to analyze data but also how to present it effectively.
Key connections between data visualization and data analysts include:
- Communicative Tool: Visualizations are the language through which analysts share insights with non-technical audiences. This communication is crucial for driving business decisions.
- Analytical Aid: Visual representations can help analysts spot trends and anomalies that might not be apparent in raw data.
- Feedback Mechanism: Visualizations can elicit responses from stakeholders, prompting discussions that lead to further data exploration.
These connections emphasize that a successful career in data analytics requires both analytical skills and the ability to communicate findings effectively through visualization.
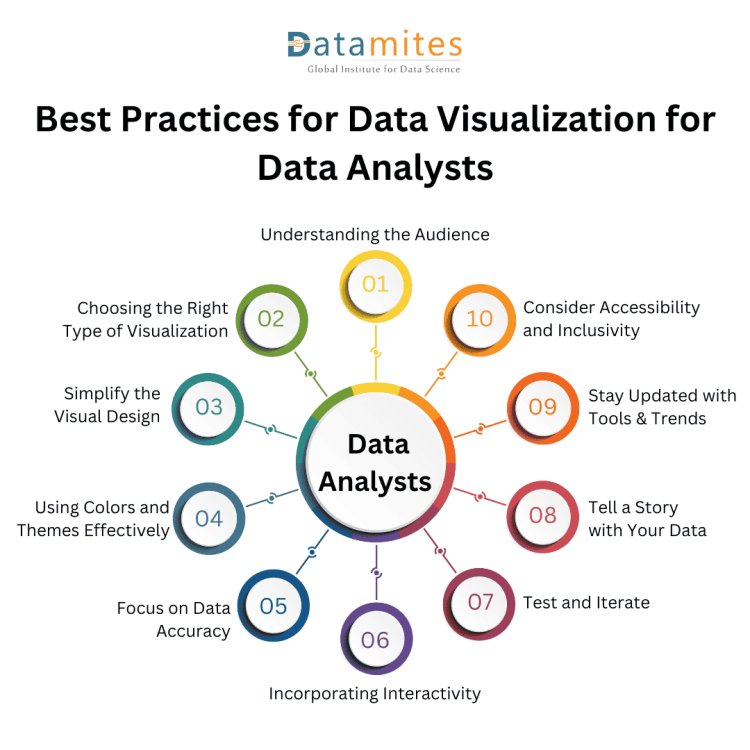
10 Best Practices for Data Visualization for Data Analysts
Data visualization is a crucial skill for data analysts, as it helps communicate complex data insights effectively. Here are ten best practices for creating impactful data visualizations:
1. Understanding the Audience: Tailoring Your Message
The first step in effective data visualization is understanding your audience. Knowing who will consume your visualizations allows you to tailor your approach accordingly. This understanding shapes the complexity, style, and context of the visual data presented.
Identify the Audience's Knowledge Level: Gauge whether your audience is technical or non-technical.
- Determine Their Needs: What insights are they seeking? What decisions do they need to make based on the data?
- Consider Their Preferences: Some audiences may prefer concise visuals, while others might appreciate detailed representations.
By customizing your visualizations to meet the audience's needs, you enhance the effectiveness of your communication.
2. Choosing the Right Type of Visualization: The Right Fit Matters
Choosing the right type of visualization is essential for effectively communicating your message. Each type of visualization has its strengths and weaknesses, depending on the data being represented.
- Match the Visualization to the Data Type: Use bar charts for categorical data and line graphs for time series data.
- Consider the Story You Want to Tell: Different visualizations evoke different responses; choose one that complements your narrative.
Choosing the right type of visualization not only aids understanding but also enhances the impact of your findings.
3. Simplify the Visual Design: Less is More
Simplicity is key when designing effective data visualizations. Overly complex designs can confuse your audience and obscure your message.
- Limit the Number of Elements: Focus on the most critical data points. Avoid cluttering the visual with unnecessary information.
- Use Clear Labels: Ensure that all axes, titles, and legends are clearly labeled to prevent ambiguity.
By adhering to the principle of simplicity, you create visuals that are easier to interpret and more likely to engage your audience.
4. Using Colors and Themes Effectively: The Power of Color
Color is a potent tool in data visualization, but it must be used judiciously. The right color scheme can enhance comprehension and draw attention to key insights.
- Restrict Your Color Palette: Using too many colors can be overwhelming. Stick to a few that complement each other.
- Use Color to Highlight Key Data: Employ contrasting colors to emphasize important data points or trends.
When used effectively, color can significantly enhance the readability and appeal of your visualizations.
5. Focus on Data Accuracy: Trust Your Data
Data visualization is only as good as the data it represents. Ensuring accuracy is crucial for maintaining credibility and trust with your audience.
- Double-Check Your Data Sources: Ensure that the data you are using is reliable and accurate.
- Visualize Raw Data Carefully: Avoid misleading representations that could distort the audience's understanding.
By prioritizing data accuracy, you establish trust and credibility, essential elements in a successful career in data analytics.
6. Incorporating Interactivity: Engaging the Audience
Interactivity can transform static visuals into dynamic experiences. Incorporating interactive elements allows users to engage with the data, leading to deeper insights.
- Enable Hover Effects: Let users hover over data points to view additional details.
- Use Filters: Allow users to filter data to focus on specific segments.
Interactive visuals encourage exploration and can lead to greater insights than static images alone.
7. Test and Iterate: The Power of Feedback
Data visualization is an iterative process. Testing your visuals and gathering feedback can help you refine your approach and improve the overall effectiveness of your presentations.
- Conduct User Testing: Share your visuals with a small group before a larger presentation to gather insights on clarity and effectiveness.
- Be Open to Critique: Accept feedback and use it to make necessary adjustments.
By iterating on your designs, you ensure that your visualizations resonate with your audience.
8. Tell a Story with Your Data: Crafting a Narrative
A compelling data story can captivate your audience and provide context for the numbers. By weaving a narrative into your visualizations, you make the data more relatable.
- Define a Clear Message: What do you want your audience to take away from your visualizations?
- Use Visuals to Support Your Story: Choose visualizations that enhance your narrative and reinforce key points.
A well-crafted story can elevate your data visualization from mere presentation to persuasive communication.
9. Stay Updated with Tools and Trends: Embrace Change
The field of data visualization is constantly evolving. Staying updated with the latest tools and trends can enhance your skills and keep your visualizations fresh.
- Explore New Tools: Familiarize yourself with the latest data visualization software to expand your capabilities.
- Follow Industry Trends: Keep an eye on emerging trends in data visualization, such as AI-driven analytics or augmented reality.
By staying informed, you can leverage new opportunities and continuously improve your data visualization skills.
10. Consider Accessibility and Inclusivity: Making Data Available for All
Ensuring that your visualizations are accessible to a diverse audience is not just a best practice; it's an ethical responsibility. Consider the following:
- Use Colorblind-Friendly Palettes: Design visuals that can be interpreted by those with color vision deficiencies.
- Provide Alternative Text: Include descriptions for visuals to assist those using screen readers.
By prioritizing accessibility, you ensure that your insights reach and resonate with a broader audience.
Refer these articles:
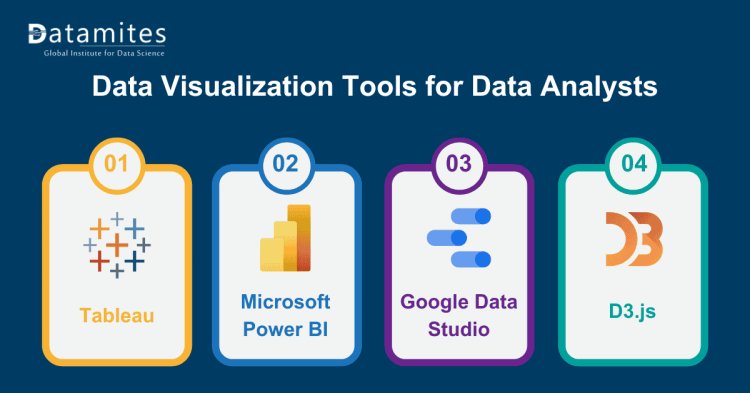
Data Visualization Tools for Data Analysts
Using the right tools can greatly enhance the quality of your data visualizations. Here are some popular Data Analyst tools that every data analyst should consider:
- Tableau:Renowned for its intuitive interface and robust visualization features.
- Microsoft Power BI: A versatile tool that integrates well with Microsoft products.
- Google Data Studio: An accessible option for creating interactive dashboards using Google services.
- D3.js: A JavaScript library that allows for custom, interactive data visualizations.
Choosing the right tool depends on your specific needs, but familiarity with multiple tools can enhance your versatility as a data analyst.
In conclusion, mastering data visualization is crucial for any aspiring data analyst. By following best practices and staying updated with tools and trends, you can effectively communicate insights that drive informed decision-making. Whether through a Data Analytics course or Data Analytics training, enhancing your skills in this area can significantly impact your career in data analytics.
DataMites Institute is a premier provider of professional training in data science and analytics. Their extensive offerings, including the Certified Data Analyst Course and Data Analytics Course, are tailored to equip students with crucial skills for interpreting and analyzing data. In collaboration with respected organizations like IABAC and NASSCOM FutureSkills, DataMites provides industry-recognized certifications. The institute also offers a wide range of programs, such as Artificial Intelligence, Data Science, Machine Learning, and Python Programming, each designed to address the evolving needs of the tech industry, thereby enhancing career opportunities and technical proficiency.

