Mastering Microsoft Power BI: A Guide for Beginners
Learn the fundamentals of Microsoft Power BI with this beginner’s guide, covering data visualization, dashboard creation, and DAX functions to enhance business insights.
In today’s world, knowing how to analyze and show data is super important. That’s where Power BI comes in. It’s a tool that helps businesses understand and use their data better. This guide will teach you all about Power BI, starting with the easy stuff and moving to the harder parts. We’ll use examples and clear explanations, so even if you’re new to this, you’ll get it. By the end, you’ll know how to use Power BI to find useful info in data, make smart choices, and help your business grow. Let’s dive in and learn about Power BI together!
Introduction to Microsoft Power BI
Power BI is like a super-smart tool made by Microsoft to help people understand and use data better. It’s really useful for beginners because it’s easy to use and works well with other Microsoft programs. With Microsoft Power BI, you can turn boring data into colorful charts and graphs that make it easy to see what’s going on. It helps you explore data, clean it up, and even predict things based on it. So, if you’re just starting out with data analysis, Power BI is a great place to begin!
How Power BI Helps in Analyzing Data and Making Decisions:
- Making Data Pretty: Power BI lets you take boring spreadsheets full of numbers and turn them into colorful charts and graphs. These visuals make it much easier to see what your data is trying to tell you.
- Digging Deeper: Once you have your data in Power BI, you can explore it in different ways. You can filter it, sort it, and drill down into specific parts to uncover hidden patterns or trends you might have missed.
- Fixing Up Data: Sometimes, data can be messy or not quite right. Microsoft Power BI helps you clean it up and organize it, so it’s easier to work with. You can remove duplicates, fix errors, and even combine data from different sources.
- Predicting the Future: With Power BI, you can do more than just look at past data. You can use it to make predictions about what might happen in the future based on trends you’ve spotted. This can help you make smarter decisions and plan for what’s ahead.
Overall, Power BI is a handy tool for beginners because it’s simple to use and can make working with data a lot more fun and insightful!
Read this article: Tableau Vs Microsoft Power BI
The Growing Demand for Microsoft Power BI
In a rapidly evolving digital landscape, the demand for robust business intelligence (BI) solutions has never been higher. With the BI market projected to soar to a staggering $39.35 billion by 2027, organizations worldwide are turning to advanced analytics tools to gain actionable insights from their data. Among the frontrunners in this arena is Microsoft Power BI, boasting a significant market share of 15.87%.
As the second-ranking BI platform, Microsoft Power BI empowers businesses to harness the full potential of their data, driving informed decision-making and sustainable growth. Its intuitive interface, seamless integration with Microsoft’s ecosystem, and powerful analytical capabilities make it a preferred choice for enterprises of all sizes. With features like interactive dashboards, AI-driven insights, and real-time data connectivity, Microsoft Power BI equips organizations with the tools they need to stay agile and competitive in today’s data-driven economy.
In this landscape of innovation and transformation, Power BI stands out as a beacon of intelligence, enabling businesses to navigate complexities and unlock new opportunities with confidence.
Getting Started with Microsoft Power BI
Microsoft Power BI is an incredibly powerful tool for data analysis and visualization. If you’re new to Power BI, getting started is easy! In this guide, we’ll walk you through the steps to download and install Power BI Desktop, and then take you on a beginner’s tour of the Power BI interface.
Downloading and Installing Power BI Desktop:
- Visit the official Power BI website: Go to https://powerbi.microsoft.com/en-us/desktop/ in your web browser.
- Click on “Download free” or “Try free”: You’ll find this button prominently displayed on the webpage. Clicking it will start the download process.
- Install Power BI Desktop: Once the download is complete, locate the downloaded file on your computer and double-click it to begin the installation process. Follow the on-screen instructions to complete the installation.
- Launch Power BI Desktop: After installation, you can launch Power BI Desktop from your desktop or start menu.
Now that you have Power BI Desktop installed, let’s take a look at the interface.
A Beginner’s Tour of the Microsoft Power BI Interface:
Welcome Screen: When you first launch Power BI Desktop, you’ll see a welcome screen with options to start a new report, open an existing file, or connect to data.
Ribbon Menu: At the top of the screen, you’ll find the Ribbon menu, which contains tabs such as Home, Insert, View, and others. These tabs contain various commands and tools for working with your data and creating visualizations.
Report View: The main area of the screen is the Report view, where you’ll build your reports and visualizations. Here, you can drag and drop fields from your data onto the canvas to create charts, tables, and other visualizations.
Fields Pane: On the right side of the screen, you’ll find the Fields pane, which displays a list of all the fields available in your dataset. You can use the Fields pane to drag fields onto your report canvas or to apply filters to your data.
Visualization Panes: Depending on what you’re working on, you may see additional panes such as the Visualizations pane, which allows you to choose different types of visualizations for your data, or the Properties pane, where you can customize the appearance of your visualizations.
Data View: You can switch between Report view and Data view using the buttons at the bottom of the screen. In Data view, you can see a preview of your data and make any necessary adjustments or transformations.
Also refer to these below articles:
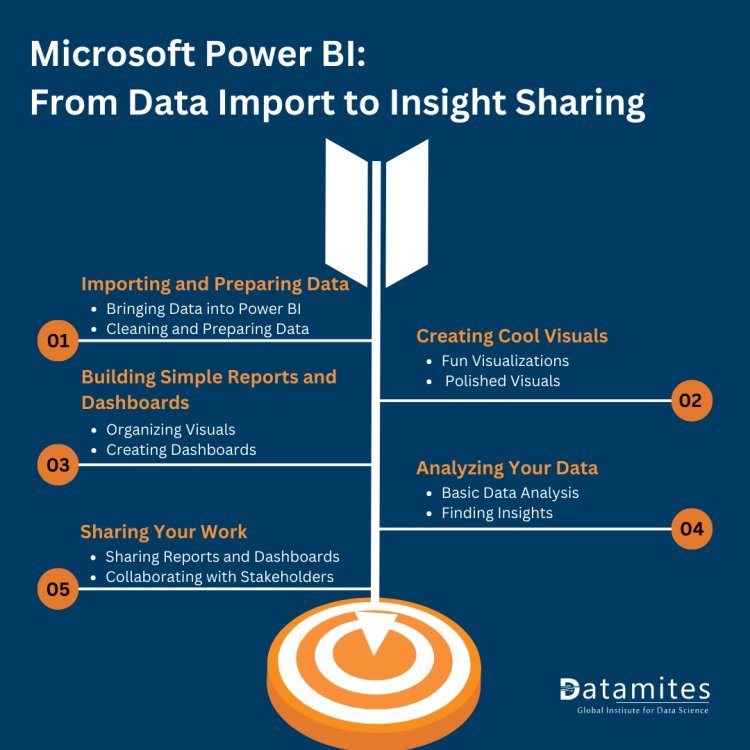
Mastering Microsoft Power BI: From Data Import to Insight Sharing
1. Importing and Preparing Data:
- Bringing Data into Power BI: Microsoft Power BI allows you to import data from various sources such as Excel spreadsheets, SQL databases, online services like Google Analytics, and more. Simply click on the “Get Data” button in Power BI Desktop, choose your data source, and follow the prompts to connect.
- Cleaning and Preparing Data: Once your data is imported, you can clean and prepare it for analysis using Power BI’s intuitive interface. Easily remove duplicates, fill in missing values, and transform your data using simple drag-and-drop operations.
2. Creating Cool Visuals:
- Fun Visualizations: Microsoft Power BI offers a wide range of visualization options, including bar charts, line graphs, pie charts, maps, and more. Experiment with different chart types to find the best way to showcase your data.
- Polished Visuals: Make your visuals look professional by customizing colors, fonts, and formatting. Power BI provides extensive formatting options to help you create visually appealing and easy-to-understand charts and graphs.
3. Building Simple Reports and Dashboards:
- Organizing Visuals: Once you’ve created your visuals, you can organize them into reports. Arrange your charts and graphs on a canvas to create a cohesive story and make it easy for others to understand your data.
- Creating Dashboards: Dashboards are like a snapshot of your data, allowing you to track key metrics at a glance. Build basic dashboards in Microsoft Power BI by pinning your favorite visuals to a dashboard canvas and arranging them to create a customized view of your data.
4. Analyzing Your Data:
- Basic Data Analysis: Microsoft Power BI includes powerful tools for data analysis, such as filters, slicers, and calculated columns. Use these tools to slice and dice your data, identify trends, and uncover insights that can inform decision-making.
- Finding Insights: Simple tricks like sorting, filtering, and drilling down into your data can reveal valuable insights. Look for patterns, outliers, and correlations that can help you understand your data better and make informed decisions.
5. Sharing Your Work:
- Sharing Reports and Dashboards: Once you’ve created your reports and dashboards, you can easily share them with others. Publish your reports to the Power BI service and share them via email, link, or embed them on websites or SharePoint.
- Collaborating with Stakeholders: Microsoft Power BI makes it easy to collaborate with teammates and stakeholders. Share your reports and dashboards with specific individuals or groups, and work together in real-time to analyze data and make decisions.
Advanced Power BI: Expanding Horizons with Power BI Service and Mobile
Exploring advanced features like Power BI Service and Mobile can significantly enhance your data analytics capabilities. Here are some resources and support options to aid you in your Power BI journey:
- Microsoft Documentation:
Microsoft’s official documentation provides comprehensive guides, tutorials, and reference materials covering all aspects of Power BI, including advanced features like Power BI Service and Mobile. You can find it at: Power BI Documentation
- Power BI Community:
The Power BI Community is an excellent place to connect with other users, ask questions, share ideas, and learn from experts. You can find forums, blogs, and user groups where you can interact with the community. Visit: Power BI Community
- YouTube Tutorials:
YouTube hosts a vast array of tutorials and walkthroughs covering Power BI’s advanced features. Channels like “Guy in a Cube,” “Enterprise DNA,” and “The BI Elite” offer high-quality content catering to different skill levels. Search for specific topics or features you’re interested in, such as Power BI Service or mobile app usage.
- Online Courses:
Platforms like DataMites and LinkedIn Learning offer courses on advanced Power BI topics. Look for Power BI Courses taught by experienced instructors with good reviews. These courses often provide structured learning paths and hands-on exercises to reinforce your understanding.
- Books:
There are numerous books available on Microsoft Power BI that cover advanced topics in detail. Some recommended titles include “Power BI Cookbook” by Brett Powell, “Mastering Microsoft Power BI” by Brett Powell and Pedro Freire, and “The Definitive Guide to DAX” by Alberto Ferrari and Marco Russo.
- Power BI User Groups:
Joining a local or virtual Power BI user group can be invaluable for networking and learning from peers. These groups often host meetings, workshops, and presentations on various Power BI topics, including advanced features and best practices.
- Microsoft Power BI Blog:
Microsoft’s official Power BI Blog regularly publishes articles, announcements, and tips on using Power BI effectively. Subscribe to stay updated on the latest features, updates, and best practices: Power BI Blog
- Consulting Partners and Training Providers:
Consider engaging with consulting partners or training providers specializing in Microsoft Power BI. They may offer customized training sessions, workshops, or consulting services tailored to your organization’s specific needs and goals.
By leveraging these resources and support options, you can deepen your understanding of Power BI’s advanced features and enhance your data analytics capabilities. Remember to stay curious, practice regularly, and seek help from the community whenever needed.
Refer these below articles:
- Data Analyst Career Scope in Bangalore
- Data Analyst Career Scope in Chennai
- Data Analyst Career Scope in Pune
- Data Analyst Career Scope in Hyderabad
In closing, as you venture further into the realm of Power BI, remember that your journey doesn’t end here. It’s just the beginning of a rewarding exploration into the world of data analytics and visualization.
DataMites Institute offers a globally accredited Power BI course, equipping professionals with advanced data visualization and analytics skills. With expert-led training and real-world projects, learners gain hands-on experience in data modeling, DAX, and dashboard creation. Recognized among India's top analytics institutes, DataMites ensures industry-relevant education for career growth. Master Power BI and excel in data-driven decision-making with DataMites!
To aid you in your quest for mastery, consider seeking out professional training and certification programs. One such option is DataMites, a global training institute offering specialized Microsoft Power BI Training and other data analytics tools. With their comprehensive curriculum and industry-recognized IABAC Certification, you can deepen your skills and validate your expertise in Power BI.