Outlier Detection and Its importance in Machine learning
Outlier detection in machine learning identifies abnormal data points that can distort model performance. Detecting and handling outliers is crucial for improving accuracy, reliability, and decision-making.

What are outliers?
Outliers are the data points of the datasets which are far away from the rest of the other data points. They can be introduced by human errors or execution errors.
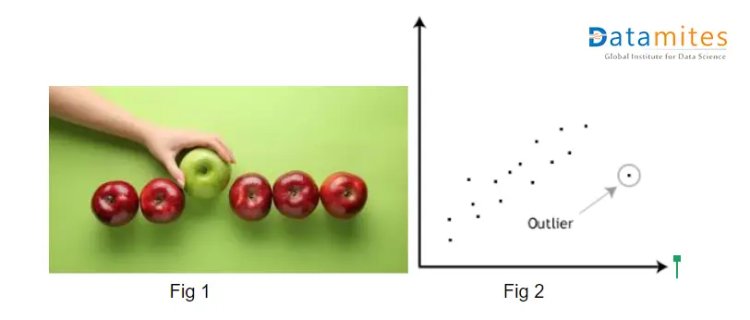
In fig 1 we have red apples along with 1 green apple. So if consider all properties that a red apple can have and plot it on X-y plane(Fig 2) than green apple will be pointed as an outlier, as properties of green apple are different from red apple. (Here properties can be considered as dimensions).
How outliers are introduced?
Generally, outliers are introduced by human mistakes. Consider we are collecting data for heart disease patients and blood pressure is an important feature to determine the risk and for some patients, the high blood pressure is noted as 1400 instead of 140.
Now when such data fed to machine learning algorithm it is likely the predictions will be misleading.
Another possible way is that when collecting data via survey, interviews, questionnaires, oral history, sensory devices, internet.
How many types of outliers?
- Point or global outliers:-
Data points anomalous with respect to the majority of data points. Consider in class, age of all students will be the same but a record with student age as 500 is an outlier. It could have been generated due to many reasons.
- Conditional Outliers
Data points are anomalous for a given specific condition. The value of data point deviates significantly from the rest of the points on the same condition. Consider a time series data for the stock market as with drastic fall of the economy due to COVID-19, the stock market almost crashed.SO the data points at this time can be considered as conditional outliers. Keeping a point, these points can be removed from the dataset because they are representing the seasonal pattern.
- Collective Outliers
A collection of data points anomalous but appear close to each other because they all have the same anomalous values. In time series normal peaks and valleys occur outside of a time frame when that seasonal sequence is normal or as a combination of time series that is in an outlier state as a group.
Cons of Outliers
A lot of mispredictions.
Bad performance on train and test data.
Pros of Outliers
- To detect rare events like fraud transactions in banks.
Detection of Outliers
When working on any machine learning task, handling of outliers is necessary. The first step in detecting outliers is via visualization.
Once we are able to visualize the outliers then it becomes quite easy to decide what actions we can take. For outlier visualization, we generally use box plots, histogram and scatter plots.
BoxPlot Visualization
This plot is present in the seaborn library and in python below code execution can straight away gives boxplot. It is known as univariate analysis
import seaborn as sns
sns.boxplot(x,data=df)
Above code will give boxplot for x variable from dataset df.
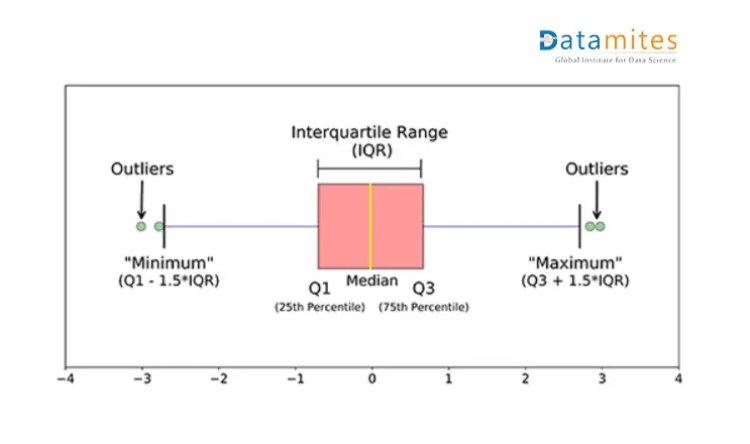
Now let’s find out what information a boxplot of the independent variable can convey
- Q1 and Q3 give 25% and 75% of data.
- Q3-Q1 is an interquartile range where data points have 95% of confidence index.
- The lines of Maximum and Minimum are boundary conditions for extreme values.
- Data points beyond Maximum and Minimum are outliers.
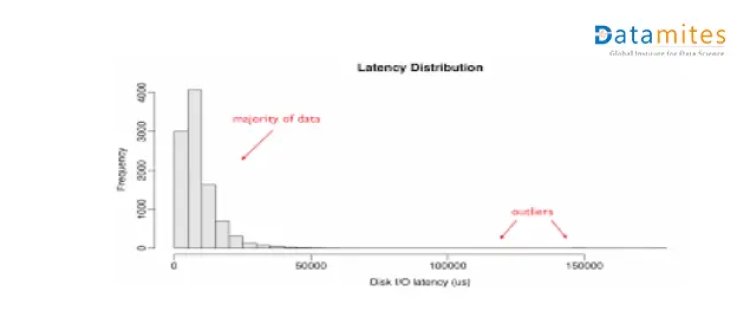
Histogram Visualization
In this distribution where the bulk of data points are on the side and few points appear away from the main group and they represent outliers.
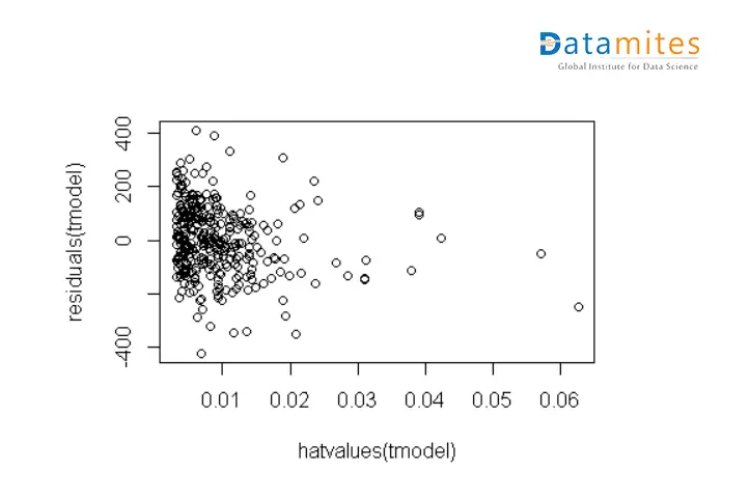
Scatter Plot
This plot helps to understand the degree of associations between two numerical variables, and any observation which is far from the normal association is an outlier.
It is multivariate analysis as based on the distribution of 2 features we are deciding the outliers.
Now we are able to visualize the outliers so next comes how to get values of data points which are actually outliers. There are numerical methods to do, let’s see each one of them.
Z Score Calculation
Z score tells how the data points are away from mean, or move over technically it’s a measure of how many standard deviations below or above the population mean a raw score is. Here we assume the data points are normally distributed. If not then we need to rescale it.
After rescaling data points which are way too far from zero will be treated as the outliers. In most of the cases, a threshold of 3 or -3 is used i.e. if the Z-score value is greater than or less than 3 or -3 respectively, that data point will be identified as outliers.
You can directly calculate Z score from scipy library
From scipy import stats
z_score=stats.zscore(df.height)
Where df is your data frame and zscore() function accepts array so you need to pass df. height.
Interquartile Range IQR Score
IQR is used to measure variability by dividing a data point into quartiles. The data is sorted in ascending order and split into 4 equal parts. Q1, Q2, Q3 called first, second and third quartiles are the values which separate the 4 equal parts.
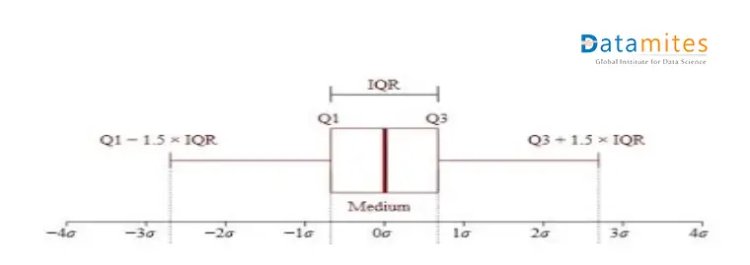
- Q1 represents the 25th percentile of the data.
- Q2 represents the 50th percentile of the data.
- Q3 represents the 75th percentile of the data.
InterQuartile range is given as QR = Q3 – Q1
The data points which fall below Q1 – 1.5 IQR or above Q3 + 1.5 IQR are outliers
IQR calculation in python using scipy library
from scipy import stats
data = [32,36,46,47,56,69,75,79,79,88,89,91,92,93,96,97,
101,105,112,116]
#Interquartile range (IQR)
IQR = stats.iqr(data, interpolation = ‘midpoint’)
print(IQR) ## 34
##min and max limit calculation
#First quartile (Q1)
Q1 = data.quantile(0.25)
#Third quartile (Q3)
Q3 =data.quantile(0.75)
min_limit=Q1 – 1.5 IQR
max_limit=Q3 +1.5IQR
FIlter data on above min and max values and that will be your outlier.
How to treat outliers?
- Check the percentage of outliers in your dataset. If it is too high then don’t drop it. Instead, impute them with mean or median value.
- If the percentage is less and the overall data size is large then you can drop the outliers.
The other way is to get outliers and their treatment from the dataset based on machine learning algorithms that we will discuss in the next blog.
The DataMites Machine Learning course provides expert-level training in AI-driven data analysis, enabling computers to learn from experience and execute tasks accurately without explicit programming. Accredited by IABAC and NASSCOM FutureSkills, DataMites is a renowned leader in Machine Learning and AI education. With over a decade of experience, the institute has empowered more than 100,000 learners globally.