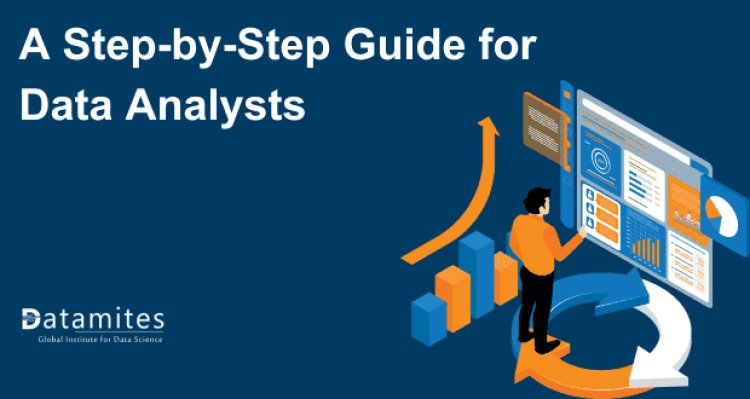
The Data Analytics Lifecycle: A Step-by-Step Guide for Data Analysts
Can you believe that 90% of the world’s data has been generated in merely the past two years? This staggering statistic highlights the exponential growth of data and its critical role in shaping business strategies. In an era where data-driven decision-making is paramount, the ability to transform raw data into actionable insights becomes essential.
Grasping the data analytics lifecycle is essential for every data analyst's success. This systematic approach not only enhances the ability to analyze data but also fosters informed decision-making. This blog aims to provide a clear, step-by-step guide through each stage of the lifecycle, equipping you with the knowledge necessary to thrive in the data analytics field. Whether you’re enrolled in a data analyst course or seeking additional data analyst training, this guide will serve as a valuable resource.
What is the Data Analytics Lifecycle?
The data analytics lifecycle encompasses a series of stages that data analysts follow to turn raw data into meaningful insights. This process typically includes problem definition, data collection, data cleaning, data exploration, data analysis, interpretation of results, and deployment of solutions. Each stage is integral to ensuring that the analysis is thorough and effective.
Importance of the Data Analytics Lifecycle
Each phase of the data analytics lifecycle contributes uniquely to informed decision-making:
- Problem Definition: Forms the basis for the entire analytical process.
- Data Collection: Gathers relevant data, ensuring that the analysis is based on accurate information.
- Data Cleaning: Refines the dataset, eliminating errors that could skew results.
- Data Exploration: Identifies trends and patterns, providing insights that might not be immediately apparent.
- Data Analysis: Transforms data into actionable insights using various analytical methods.
- Interpretation of Results: Helps stakeholders understand the implications of the findings.
- Deployment: Implements insights in real-world scenarios to drive business decisions.
Below is an infographic that visually represents the lifecycle phases, making it easier to understand the flow of data analytics.

Step 1: Problem Definition – The Foundation of Insight
A clear understanding of the business problem is the cornerstone of effective data analysis. By defining the problem upfront, data analysts can focus their efforts on relevant data and insights. This phase requires analysts to ask critical questions:
- What specific issue are we trying to address?
- Why is this problem important to the organization?
- What are the desired outcomes of resolving this issue?
For example, consider a retail company facing declining sales. A well-defined problem statement could be: “How can we increase sales by 20% in the next quarter?” This clarity directs the subsequent analysis and keeps the team focused on the end goal.
Formulating Questions
Once the business problem is identified, the next step is crafting specific, measurable questions that guide the analysis. Effective questions might include:
- What customer segments are underperforming?
- What products are seeing the sharpest drop in sales?
- What external factors might be influencing sales trends?
By formulating precise questions, analysts can streamline their data collection and analysis efforts, ensuring that they stay on track.
Refer these articles:
- Introduction to SQL for Data Analytics
- Why Data Analyst Career in 2024
- The Role of Data Analytics in Business Decision Making
Step 2: Data Collection – Harvesting Valuable Resources
Data collection is a vital step in the analytics lifecycle, as it lays the groundwork for all subsequent analysis. Analysts typically utilize two main types of data sources:
- Primary Data: This is data collected firsthand through methods like surveys, interviews, or experiments. It provides tailored insights directly relevant to the business problem.
- Secondary Data: This includes existing data from sources like industry reports, academic studies, and online databases. While it may not be as specific, it can still provide valuable context.
Analysts often leverage tools and platforms for data collection, including:
- Online survey tools (e.g., SurveyMonkey)
- APIs for extracting data, such as information from social media platforms.
- Web scraping techniques to gather data from websites
Ensuring Data Quality
Before diving into analysis, it is essential to validate the integrity and accuracy of the collected data. Erroneous information can lead to misleading conclusions and poor decision-making. Here are a few strategies to maintain data integrity:
- Conduct preliminary data checks to identify missing values and outliers.
- Employ diverse validation methods and techniques to ensure the accuracy of data.
- Consistently refresh data sources to ensure they remain current and trustworthy.
By prioritizing data quality, analysts can ensure that their conclusions are based on solid foundations.
Step 3: Data Cleaning: The Craft of Polishing
Data cleaning is an often-overlooked but critical step in the analytics lifecycle. Dirty data, which includes inaccuracies, duplicates, and inconsistencies, can result in misleading insights. Therefore, ensuring data cleanliness is paramount.
To illustrate, consider a scenario where customer purchase records contain duplicate entries. If these duplicates are not addressed, the analysis may inaccurately reflect customer behavior, leading to misguided business decisions.
Techniques for Data Cleaning
There are various methods that can be utilized to efficiently clean data.
- Handling Missing Values: Decide whether to fill in, remove, or leave missing data based on its impact on the analysis.
- Outlier Detection: Identify and address outliers that may skew results using statistical methods.
- Normalization: Unify data formats to maintain consistency across different datasets.
Analysts have access to a range of tools for the purpose of data cleaning.
- Python libraries (e.g., Pandas, NumPy)
- Spreadsheet applications (e.g., Microsoft Excel)
- Specialized data cleaning software (e.g., OpenRefine)
By refining the dataset, analysts can improve the reliability of their analyses.
Refer these articles:
- What is Datamites Certified Data Analyst Certification
- What is Certified Data Scientist Course
- What Is AI Engineer Course
Step 4: Data Exploration – Discovering Hidden Patterns
Exploratory Data Analysis (EDA) plays a crucial role in uncovering hidden trends and relationships within the data. This process involves visualizing data distributions and examining correlations among variables. Exploratory Data Analysis (EDA) enables analysts to grasp the fundamental patterns within the data, facilitating a path toward more profound insights.
Common techniques used in EDA include:
- Descriptive statistics to summarize data characteristics.
- Correlation matrices to identify relationships between variables.
- Grouping and aggregating data for comparative analysis.
Visualization Techniques
Data visualization is an essential component of EDA, as it transforms complex data into intuitive graphical representations. Effective visual storytelling can communicate insights clearly and impactfully. Popular visualization techniques include:
- Bar charts for categorical comparisons.
- Line graphs for trend analysis over time.
- Heatmaps for displaying correlations between variables.
Recommended visualization tools include:
- Tableau: An intuitive platform designed for crafting interactive dashboards.
- Matplotlib: A Python library designed for creating static, animated, and interactive visualizations.
- Seaborn: Another Python library that simplifies the creation of informative statistical graphics.
By utilizing visualization techniques, analysts can convey their findings more effectively.
Step 5: Data Analysis – Turning Data into Actionable Insights
In this phase, analysts select appropriate methods for analyzing the data, depending on the nature of the problem and the available data. Key analytical methods include:
- Descriptive Analytics: Analyzes historical information to gain insights into past events.
- Diagnostic Analytics: Analyzes historical performance to uncover the reasons behind a particular outcome.
- Predictive Analytics: Employs statistical models to predict future events.
- Prescriptive Analytics: Suggests courses of action informed by data insights.
Selecting the appropriate analytical method is essential for generating valuable insights that guide effective decision-making.
Implementing Statistical Techniques
Statistical methods and algorithms play a crucial role during the data analysis stage. Analysts may apply techniques such as regression analysis, hypothesis testing, and machine learning algorithms to extract insights from the data. For example, predictive modeling can be used to anticipate customer actions by analyzing past buying habits.
A real-world application of predictive modeling might involve a retail company using past sales data to anticipate future product demand. This insight allows companies to enhance their inventory management and boost customer satisfaction.
Step 6: Understanding the Results – Analyzing the Discoveries
Once the data has been analyzed, it’s time to draw conclusions based on the findings. Analysts should interpret the results in the context of the original business problem, ensuring that the insights are relevant and actionable. Here are some guiding questions:
- What patterns or trends emerged from the analysis?
- How do these findings relate to the initial business problem?
- What are the potential implications for the organization?
By synthesizing the analysis results, analysts can provide meaningful conclusions that drive strategic decisions.
Communicating Findings Effectively
Communicating results to stakeholders is equally important as the analysis itself. Utilizing effective presentation techniques can significantly improve comprehension and boost audience engagement. Consider the following strategies:
- Utilize storytelling techniques to make data relatable.
- Create comprehensive reports that summarize key findings.
- Employ visuals to illustrate data trends and insights.
By effectively communicating findings, analysts can ensure that their insights resonate with decision-makers and inspire action.
Refer these articles:
- Data Analyst Course Fee in India
- Data Analyst Course Fee in Bangalore
- Data Analyst Course Fee in Pune
Step 7: Deployment – Implementing Solutions
The final step of the data analytics lifecycle is deployment, where insights are translated into actionable strategies. Analysts must collaborate with stakeholders to implement these strategies, ensuring alignment with business objectives. Strategies may include:
- Developing marketing campaigns based on customer insights.
- Optimizing operational processes to improve efficiency.
- Modifying product offerings to align with current market trends.
Successful deployment requires ongoing communication and collaboration between analysts and stakeholders.
Monitoring and Maintenance
After implementation, it is essential to monitor and evaluate the effectiveness of the deployed strategies. Continuous evaluation allows organizations to adapt and refine their approaches based on data. Here’s how to maintain momentum:
- Define essential metrics to evaluate performance and determine success.
- Regularly analyze new data to identify trends and areas for improvement.
- Foster an environment where decisions are guided by data insights throughout the organization.
By adopting a proactive mindset, organizations can guarantee that their strategies stay relevant and impactful.
Real-World Applications of Data Analytics
Data analytics has become a crucial component across various industries, transforming the way businesses operate, make decisions, and engage with customers. Here are some real-world applications of data analytics across different sectors:
Business Intelligence
More and more companies are utilizing data analytics to improve their decision-making processes. By utilizing analytics, organizations can identify market trends, customer preferences, and operational inefficiencies. This insight allows for informed strategic planning and competitive advantage.
Healthcare
In healthcare, data analytics plays a pivotal role in patient care and predictive modeling. Analysts use data to identify potential health risks, optimize treatment plans, and improve patient outcomes. For instance, predictive analytics can forecast patient readmission rates, enabling healthcare providers to tailor interventions accordingly.
Retail and E-Commerce
- Customer Personalization: Retailers analyze customer preferences, purchase history, and browsing patterns to deliver personalized product recommendations and targeted marketing.
- Inventory Management: Predictive analytics enables retailers to anticipate demand, fine-tune inventory levels, and minimize both overstock and stock shortages.
- Pricing Strategy: Dynamic pricing models are used to adjust prices in real-time based on customer demand, competitor pricing, and inventory levels.
Marketing
Data analytics empowers marketers to create personalized customer experiences. By analyzing consumer behavior, preferences, and demographics, companies can develop targeted marketing campaigns that resonate with their audience, ultimately driving sales and brand loyalty.
Logistics and Transportation
- Route Optimization: Logistics firms leverage data analytics to identify optimal delivery routes, thereby minimizing fuel usage and speeding up delivery times.
- Fleet Management: Analytics enables the monitoring of vehicle performance and the optimization of maintenance schedules, leading to fewer breakdowns and enhanced overall efficiency of the fleet.
- Demand Forecasting: Ride-hailing services, like Uber and Lyft, use predictive analytics to anticipate demand in different areas and times, optimizing driver allocation.
The data analytics lifecycle is a comprehensive framework that guides analysts from problem definition to solution deployment. By adopting a mindset of continuous improvement and learning, aspiring data analysts can harness the power of data to drive meaningful insights. Whether you’re taking a data analyst course or engaging in data analyst training, embracing this lifecycle will set you on a path to success.
We encourage you to share your experiences or questions related to data analytics in the comments below. Let’s cultivate a thriving community dedicated to learning and development in the realm of data analytics!
DataMites Institute stands out as a premier establishment focused on empowering individuals with sophisticated data analytics expertise. Our Certified Data Analyst Course is carefully crafted to provide learners with in-depth knowledge and practical experience in data analysis, positioning them to thrive in a competitive job market. Our curriculum is designed to meet the highest industry standards and best practices, backed by esteemed accreditations from organizations such as IABAC and NASSCOM FutureSkills.
At DataMites, we are dedicated to delivering exceptional education and training that keeps pace with the dynamic demands of the data analytics landscape. Our team of expert instructors and state-of-the-art resources create a robust learning atmosphere, equipping students to confidently address real-world data challenges. Choose DataMites Institute to elevate your career and earn a globally recognized credential.