Top Features of Power BI for Effective Data Analysis
Discover the top features of Power BI that enhance data analysis, including interactive dashboards, AI-powered insights, and advanced DAX functions. Learn how these powerful tools help businesses make data-driven decisions efficiently.
Power BI is a powerful tool used for data analysis, enabling users to transform raw data into meaningful insights. In this article, we’ll explore the top features of Power BI that make it an indispensable tool for effective data analysis. Whether you’re a beginner or an experienced analyst, understanding these features will enhance your ability to derive valuable insights from your data. Let’s delve into the key functionalities that set Power BI apart and empower users to make informed decisions based on data-driven insights.
Introduction to Power BI in Data Analysis
Power BI is a game-changer in the world of data analysis. Developed by Microsoft, it’s a versatile software tool designed to help individuals and organizations harness the power of their data. Its importance lies in its ability to transform raw data into meaningful insights, enabling informed decision-making. Whether you’re a small business owner, a data analyst, or a corporate executive, Microsoft Power BI empowers you to unlock the potential within your data, driving efficiency and growth.
Microsoft Power BI commands a significant market share of 33%, owed to its user-friendly interface and robust reporting capabilities. (Linkedin) It seamlessly integrates with Microsoft Office, enhancing workflow efficiency. With its intuitive design, users can effortlessly generate powerful reports and extract insights from their data, making it a preferred choice for businesses seeking streamlined data analytics solutions.
At its core, Power BI simplifies the complexities of data analysis. With intuitive features and user-friendly interfaces, it allows users to seamlessly connect to various data sources, visualize data through interactive reports and dashboards, and share insights across teams effortlessly. Its usefulness for data analysis extends beyond just creating charts and graphs; it enables users to perform advanced analytics, identify trends, and forecast future outcomes. In essence, Power BI streamlines the data analysis process, making it accessible and actionable for everyone, regardless of their technical expertise.
Refer to this article: Mastering Microsoft Power BI: A Guide for Beginners
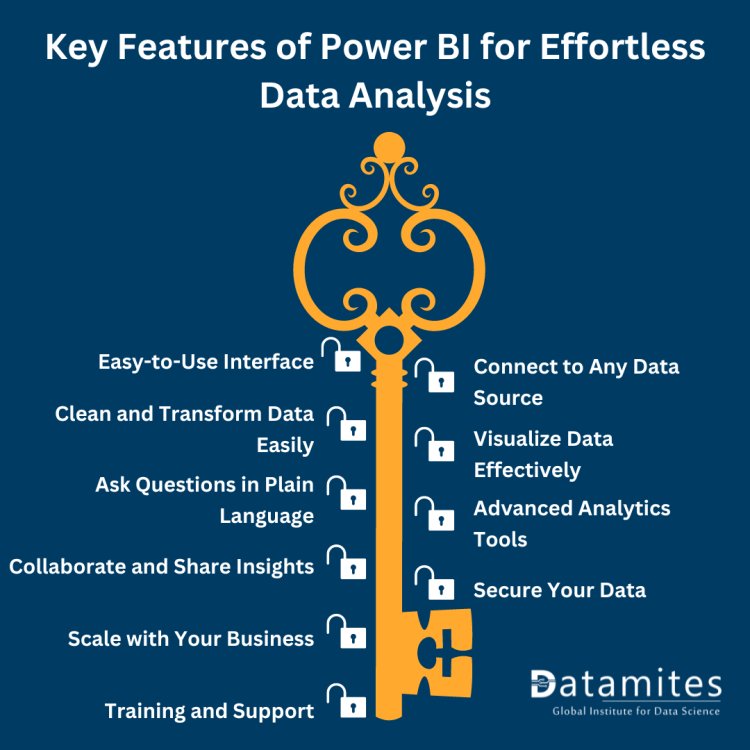
Unveiling Key Features of Power BI for Effortless Data Analysis
Easy-to-Use Interface:
Power BI has a simple and easy-to-understand interface. It’s like using your favorite apps on your phone. You can easily find what you need and customize things just the way you like them. This makes building reports and dashboards a breeze, even if you’re not a tech whiz.
Connect to Any Data Source:
With Power BI, you can grab data from pretty much anywhere. Whether it’s sitting in an Excel file on your computer, stored in a database, or floating in the cloud, Power BI can pull it in. It’s like having a magic wand that can reach out and gather data from all your different sources. Plus, it connects directly to popular platforms like Salesforce and Google Analytics, making life even easier.
Clean and Transform Data Easily:
Data can be messy, but Power BI helps tidy it up. It’s like having a virtual cleaning crew for your data. With tools like Power Query, you can quickly whip your data into shape, getting rid of any junk and making sure everything is ready for analysis. Think of it as organizing your closet before a big event – everything looks better and is easier to find.
Visualize Data Effectively:
Once your data is all nice and tidy, it’s time to make it look pretty. Power BI offers lots of different ways to visualize your data – like charts, graphs, and maps. It’s like turning boring numbers into a colorful story that anyone can understand. And with interactive features, you can dive deeper into your data to uncover even more insights.
Ask Questions in Plain Language:
Ever wish you could just ask your data a question and get a straight answer? With Power BI’s Natural Language Query (NLQ) feature, now you can. It’s like having a conversation with your data – just type in your question, and Power BI will do its best to give you a clear answer. It’s perfect for when you’re curious about something but don’t want to get lost in the technical details.
Advanced Analytics Tools:
Power BI isn’t just for making pretty pictures – it’s also packed with powerful analytics tools. Think of it as having a toolbox full of gadgets for analyzing your data. From forecasting future trends to digging into the nitty-gritty details with statistical analysis, Power BI has everything you need to take your analysis to the next level.
Collaborate and Share Insights:
Once you’ve uncovered all those juicy insights, you’ll want to share them with your team. Power BI makes collaboration easy, with shared workspaces where everyone can come together to discuss findings and make decisions. And when it’s time to share your reports, you can send them via email or embed them on your company’s website for everyone to see.
Secure Your Data:
Keeping your data safe and sound is crucial, and Power BI takes security seriously. With features like role-based access control and encryption, you can rest easy knowing that only the right people have access to your data. Plus, Power BI complies with all the latest data privacy standards, so you can trust that your data is in good hands.
Scale with Your Business:
As your business grows, so does your data – but Power BI can handle it. It’s like having a trusty sidekick that grows with you, always ready to tackle whatever challenges come your way. And because it integrates seamlessly with other Microsoft tools, you can keep your workflows running smoothly no matter how big you get.
Training and Support:
Not sure where to start? Power BI offers plenty of training resources to help you get up to speed. From online tutorials to community forums where you can ask questions and get advice, there’s always someone there to lend a helping hand. Plus, if you’re looking to prove your skills, you can even get Certified in Power BI – it’s like getting a badge of honor for your data prowess.
Real-World Examples:
Power BI isn’t just a fancy tool – it’s making a real difference in the world. Companies all over the globe are using Power BI to make smarter decisions and drive business growth. Whether it’s spotting trends in sales data or uncovering inefficiencies in operations, Power BI is helping organizations of all sizes achieve their goals. It’s like having a secret weapon for success – and once you start using it, you’ll wonder how you ever lived without it.
Read the below articles:
- Bangalore’s Data Analyst Career Scope
- Chennai’s Data Analyst Career Scope
- Pune’s Career Scope for Data Analysts
- Hyderabad Career Scope for Data Analysts
As you continue your journey with Power BI, remember that there’s always more to discover. Take advantage of the training resources available, dive deeper into its advanced functionalities, and explore real-world applications to unlock its full potential. Whether you’re a beginner or an experienced user, Power BI offers endless opportunities for growth and innovation in the realm of data analysis. So, keep exploring, keep learning, and let Power BI empower you to make smarter, data-driven decisions for success in your endeavors.
DataMites provides a globally recognized Power BI course, designed to equip professionals with cutting-edge data visualization and analytics skills. With expert mentorship and hands-on projects, learners master data modeling, DAX, and interactive dashboard creation. As one of India’s leading analytics institutes, DataMites delivers industry-focused training for career growth. Elevate your business intelligence expertise and excel in data-driven decision-making with DataMites!
With DataMites as a global training institute, offering comprehensive Microsoft Power BI Training leading to IABAC certification, individuals can deepen their expertise and harness the full potential of this transformative tool. Whether you’re a beginner or an experienced analyst, investing in Microsoft Power BI Course with DataMites ensures you’re equipped to make informed decisions and drive business success through data-driven insights.