Covariance in Data Science: What It Means and Why It Matters
Covariance shows how two variables move together. In data science, it helps reveal relationships and trends, guiding predictions and deeper insights into data behavior.
In the world of Data Science, understanding how variables relate to each other is key to making sense of data. Imagine this on hotter days, ice cream sales go up. When temperatures drop, sales go down. Both temperature and ice cream sales move together this relationship is what we call covariance.
Covariance in Data Science helps analysts and machine learning professionals identify how two factors change in relation to each other. Whether it’s predicting customer behavior, improving models, or understanding feature relationships, covariance plays an important role in data analysis and decision-making.
What Is Covariance in Data Science?
In simple terms, covariance measures how two variables vary together. If one variable increases while the other also increases, the covariance is positive. If one goes up while the other goes down, it’s negative.
For example, imagine a dataset of students showing their study hours and exam scores. As study hours increase, scores generally rise showing positive covariance.
On the other hand, if you compare exercise time and body fat percentage, as exercise time increases, body fat tends to decrease showing negative covariance.
Variance, which many are familiar with, is just the covariance of a variable with itself. So, covariance expands this idea to see how two different variables interact.
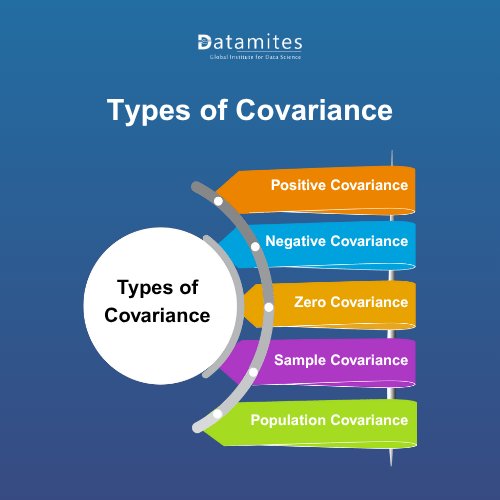
Types of Covariance
Covariance can be categorized in several ways depending on the relationship and dataset type. Here are the most common ones:
Positive Covariance
Occurs when two variables move in the same direction. For example, height and weight often show positive covariance because taller people generally weigh more. In Data Science, identifying positive covariance helps understand which features reinforce each other, making predictions easier.
Negative Covariance
Happens when one variable increases while the other decreases, showing an inverse relationship. A common example is exercise time versus body fat as exercise increases, body fat tends to decrease. Recognizing negative covariance helps detect variables that balance each other in models.
Zero Covariance
Occurs when variables show no consistent relationship. For instance, shoe size and IQ typically exhibit zero covariance. Understanding this prevents false assumptions and ensures meaningful variables are used in analysis.
Sample Covariance
Calculated from a subset of data rather than the full population, sample covariance is widely used in practical Data Science for surveys, experiments, and exploratory data analysis.
Population Covariance
Derived from the entire dataset, population covariance provides an exact measure of variable relationships. Though less common in day-to-day analysis, it forms the foundation for statistical theory and precise large-scale calculations.
In Data Science, positive, negative, and sample covariance are the most commonly used types. These relationships help analysts understand whether variables move in sync or independently a foundation for building predictive models.
Why Covariance Matters in Data Science
Understanding covariance is essential in Data Science because it helps analysts and data professionals uncover relationships, improve models, and make informed decisions. Here are the key points that highlight its importance:
- Identify Relationships: Covariance shows how variables move together, helping uncover patterns in data.
- Exploratory Data Analysis (EDA): Helps determine which variables are related before building models.
- Feature Engineering: Guides selection or transformation of features for better predictions.
- Understand Data Patterns: Provides insight into how features behave collectively, improving model accuracy.
- Foundation for Correlation: Covariance is the basis for correlation, a standardized measure widely used in statistics and machine learning.
- Reduce Redundant Data: Helps eliminate irrelevant or overlapping variables, making models more efficient.
- Supports Advanced Techniques: Underpins PCA and other machine learning algorithms for better data analysis.
- Career Relevance: Mastering covariance strengthens analytical thinking, decision-making, and builds skills essential for a successful Data Science career.
The significance of concepts like covariance isn’t just academic, it’s reflected in the expanding data science market. MarketsandMarkets projected the data-science platform market to grow from US $95.3 billion in 2021 to US $322.9 billion by 2026 (CAGR ≈ 27.7%), showing how global industries are rapidly reinvesting in analytics platforms and data-driven decision tools. This growth underscores why mastering foundational concepts such as covariance is crucial for anyone aiming to build or advance a data science career.
Refer to these articles:
- Histogram in Data Science: A Quick Guide with Examples
- Understanding Data Archiving in Data Science
- Why Cloud Computing Skills Are Important for Data Scientists
Covariance Formula: Step-by-Step Calculation with Example
Let’s look at the basic formula for covariance (simplified version):
Cov(X,Y)=∑(Xi−Xˉ)(Yi−Yˉ)n−1Cov(X, Y) = \frac{\sum (X_i - \bar{X})(Y_i - \bar{Y})}{n - 1}Cov(X,Y)=n−1∑(Xi−Xˉ)(Yi−Yˉ)
Where:
- Xi,YiX_i, Y_iXi,Yi = individual data points
- Xˉ,Yˉ\bar{X}, \bar{Y}Xˉ,Yˉ = means of the variables
- nnn = number of observations
Example: Suppose we have data on students:
| Study Hours (X) | Exam Score (Y) |
| 2 | 50 |
| 4 | 60 |
| 6 | 70 |
- Mean of X = (2 + 4 + 6)/3 = 4
- Mean of Y = (50 + 60 + 70)/3 = 60
- Compute deviations and products:
- (2−4)(50−60) = (−2)(−10) = 20
- (4−4)(60−60) = 0
- (6−4)(70−60) = (2)(10) = 20
- Sum = 40 → Covariance = 40 / (3−1) = 20
A positive result means study hours and scores increase together showing a positive covariance.
Applications of Covariance in Data Science
Covariance plays a role in many advanced techniques and real-world applications:
- Covariance Matrix for PCA: Helps reduce dataset dimensions while keeping important patterns intact.
- Financial Analysis & Risk Management: Measures how assets or stocks move together for portfolio optimization.
- Feature Selection: Identifies relationships between variables to remove redundancy and improve model accuracy.
- Pattern Detection: Finds hidden trends in large datasets for better business insights.
- Clustering & Model Optimization: Guides algorithms like K-Means and Gaussian Mixture Models for effective data grouping.
- Predictive Modeling: Supports building models that understand relationships among variables for more accurate predictions.
From predicting consumer trends to optimizing product performance, applications of covariance in Data Science are vast and impactful.
Refer to these articles:
- The Role of Data Science in Protecting Cultural Heritage
- Why Every Data Scientist Must Learn Requirement Elicitation
- Top Data Extraction Tools to Streamline Your Data Collection
Real-Life Example of Covariance in Data Science
Imagine a company tracking advertising spend and sales revenue across different regions:
| Region | Ad Spend (₹) | Sales (₹) |
| North | 10,000 | 85,000 |
| South | 8,000 | 70,000 |
| East | 15,000 | 110,000 |
| West | 12,000 | 90,000 |
By calculating the covariance between ad spend and sales, the company can see whether higher advertising budgets are linked to higher sales. A positive covariance here indicates that as advertising spend increases, sales revenue tends to increase as well.
Understanding this relationship helps businesses make data-driven decisions:
- Allocate marketing budgets effectively
- Optimize campaigns for better returns
- Predict future sales based on spending trends
This example shows how covariance in Data Science provides actionable insights from everyday business data, helping organizations improve strategies and outcomes.
For anyone pursuing a career in Data Science, understanding fundamental concepts like covariance is essential. It strengthens analytical skills, helps uncover insights, and supports informed decision-making. With growing demand across industries like finance, healthcare, marketing, and technology, mastering these skills opens excellent career opportunities worldwide.
Covariance helps us see how variables move together, a simple yet powerful idea that underpins advanced analytics and machine learning. Whether you’re a student, professional, or career changer, learning covariance is a key step toward mastering data relationships and building a strong, data-driven career in today’s world.
Step into the world of Data Science and explore how concepts like covariance in Data Science help turn raw numbers into actionable insights. Understanding covariance allows you to see how variables move together, identify patterns, and make informed decisions across industries. Enrolling in a Data Science course in Delhi, Bangalore, Chennai, Hyderabad, Pune, Coimbatore, Ahmedabad, or Mumbai can equip you with practical skills, hands-on project experience, and the analytical knowledge essential for anyone looking to excel in today’s data-driven world.
One institute leading the way is DataMites Training Institute. DataMites industry-focused curriculum emphasizes experiential learning, giving students exposure to real-world challenges through live projects and practical examples. The DataMites Certified Data Scientist courses, accredited by IABAC and NASSCOM FutureSkills, cover key topics such as Data Science, data visualization, machine learning, Python programming, Data Engineering, and Artificial Intelligence, preparing students with in-demand Data Science skills for diverse industries.
DataMites offers Data Science training in Bangalore, Hyderabad, Chennai, Pune, Coimbatore, Ahmedabad, and Mumbai, with hands-on projects, internships, and placement support. Flexible learning options allow students to choose between online or offline modes while gaining the same comprehensive training, practical applications, and career-building opportunities. Mastering covariance in Data Science and related concepts empowers students to analyze relationships between variables, improve predictive models, and strengthen their foundation for a successful Data Science career.