Data Analytics Lifecycle: From Data Collection to Insights
Did you know that 90% of the world’s data has been generated in the last two years alone? As data continues to grow at an unprecedented rate, the ability to analyze and interpret it has become more crucial than ever.
In this blog post, we'll explore the data analytics lifecycle, breaking down each stage to help you understand how data can be transformed into actionable insights.
The data analytics field is booming, driven by the increasing need for data-driven decision-making and advances in AI and machine learning. Industries such as finance, healthcare, retail, and technology are all seeking skilled professionals to convert raw data into actionable insights.
- Data Analyst roles are projected to grow by 25% in the next decade.
- Data Science positions are expected to increase by 30%.
- Business Intelligence (BI) Analysts are highly sought after for their ability to derive valuable insights.
Pursuing a data analytics course training can open doors to these expanding career opportunities and equip you with essential skills for success.
What is Data Analytics?
Data analytics refers to the systematic computational analysis of data. It involves examining datasets to draw conclusions about the information they contain. By using various techniques and tools, data analysts can uncover patterns, trends, and relationships within the data.
Importance in Today’s Data-Driven World
In a world inundated with data, analytics provides the clarity needed to make informed decisions. For instance:
Business: Companies use data analytics to understand customer behavior, optimize operations, and forecast trends.
Healthcare: Analytics helps in predicting disease outbreaks, improving patient care, and managing resources efficiently.
A data analytics certification training can provide you with the foundational knowledge to harness these insights effectively.
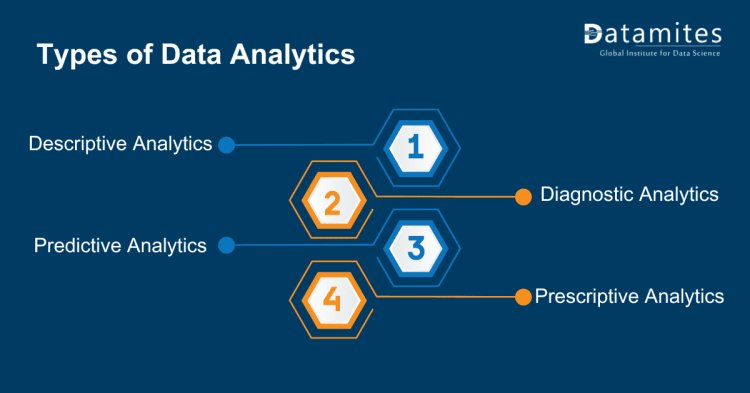
Types of Data Analytics
Data analytics encompasses various methods and techniques used to analyze data and extract meaningful insights. Here are the main types of data analytics:
Descriptive Analytics
Descriptive analytics focuses on summarizing past data to understand what has happened. It provides insights into historical trends and patterns.
Examples and Applications
- Sales Reports: Analyzing past sales data to identify trends and seasonal patterns.
- Customer Feedback: Summarizing customer reviews to gauge overall satisfaction.
Diagnostic Analytics
Diagnostic analytics digs deeper into data to understand the causes of past events. It helps in answering “why did this happen?”
Examples and Applications
- Customer Churn Analysis: Investigating reasons behind customers leaving a service.
- Incident Analysis: Examining the causes of operational disruptions.
Predictive Analytics
Predictive analytics uses statistical models and machine learning techniques to forecast future events based on historical data.
Examples and Applications
- Sales Forecasting: Predicting future sales based on past trends.
- Risk Management: Anticipating potential risks and their impact.
Prescriptive Analytics
Prescriptive analytics suggests actions to address future scenarios. It provides recommendations for decision-making based on predictive insights.
Examples and Applications
- Marketing Campaigns: Recommending strategies to optimize marketing efforts.
- Supply Chain Optimization: Advising on inventory levels to minimize costs and meet demand.
Read these articles:
Understanding the Data Analytics Lifecycle
The Data Analytics Lifecycle is a structured approach to analyzing data, designed to provide a systematic framework for data science projects. It ensures that projects are completed efficiently and effectively. Here's an overview of the main stages:
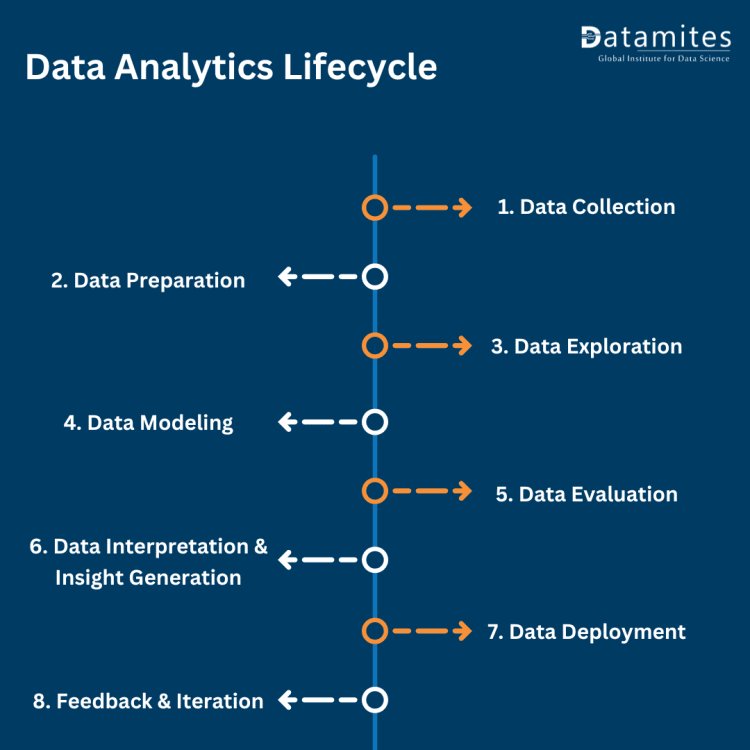
1. Data Collection
Data collection is the process of gathering raw data from various sources. It's crucial because it provides the foundational information needed for analysis, which helps in making informed decisions.
Methods:
- Surveys: Collecting responses from people through questionnaires.
- Sensors: Gathering data from physical sensors in IoT devices.
- Web Scraping: Extracting data from websites.
- APIs: Accessing data provided by external services.
- Manual Data Entry: Entering data by hand, usually for smaller datasets.
Challenges:
- Data Quality: Inaccurate or incomplete data can lead to incorrect conclusions.
- Privacy Concerns: Ensuring that data collection complies with legal and ethical standards.
- Volume: Handling large volumes of data can be challenging.
Best Practices:
- Define Clear Objectives: Know what information you need and why.
- Use Reliable Sources: Ensure that data sources are trustworthy.
- Ensure Compliance: Adhere to privacy regulations and standards.
2. Data Preparation
Data preparation involves cleaning and transforming raw data into a structured format suitable for analysis. It's essential to ensure that the data is accurate and ready for modeling.
Steps:
- Cleaning: Removing or correcting errors and inconsistencies in the data.
- Integrating: Combining data from different sources.
- Transforming: Changing data formats or structures to meet analysis requirements.
Tools:
- ETL Tools: Extract, Transform, Load tools like Talend or Apache Nifi.
- Data Wrangling Tools: Tools like Trifacta or DataRobot.
Challenges:
- Handling Missing Values: Deciding how to address gaps in data.
- Inconsistencies: Dealing with discrepancies and variations in data.
- Outliers: Identifying and managing anomalies that may affect analysis.
3. Data Exploration
Data exploration involves analyzing data using descriptive statistics and visualization techniques to understand its structure and patterns.
Techniques:
- Descriptive Statistics: Mean, median, mode, standard deviation, etc.
- Visualization: Creating charts and graphs to visually inspect data distributions and relationships.
Tools:
- Visualization Tools: Tableau, Power BI, Matplotlib.
- Statistical Software: R, Python (Pandas, Seaborn).
Challenges:
- Interpreting Visualizations: Ensuring that visualizations accurately represent the data.
- Finding Patterns: Identifying meaningful patterns and insights from data.
4. Data Modeling
Data modeling involves applying algorithms to the data to make predictions or discover patterns. This is where machine learning or statistical models are developed.
Types of Models:
- Classification: Categorizing data into predefined classes.
- Regression: Predicting numerical values based on input features.
- Clustering: Grouping similar data points together.
Process:
- Building: Creating a model based on the data.
- Training: Teaching the model using a training dataset.
- Validating: Testing the model on a separate dataset to assess its performance.
Tools:
- Machine Learning Libraries: Scikit-learn, TensorFlow, Keras.
- Frameworks: PyTorch, XGBoost.
Challenges:
- Model Accuracy: Ensuring the model performs well.
- Overfitting: Avoiding models that perform well on training data but poorly on new data.
- Underfitting: Ensuring the model captures the underlying patterns in the data.
5. Data Evaluation
Data evaluation assesses the performance of models and their outcomes to ensure they meet the desired objectives.
Metrics:
- Accuracy: The proportion of correct predictions.
- Precision and Recall: Metrics for evaluating classification models.
- F1 Score: A balance between precision and recall.
Validation Techniques:
- Cross-Validation: Dividing data into subsets to validate model performance.
- Confusion Matrix: A table used to evaluate classification models.
Challenges:
- Ensuring Robustness: Validating models against diverse data scenarios.
- Interpreting Metrics: Understanding what metrics indicate about model performance.
6. Data Interpretation and Insight Generation
Data interpretation involves translating model results into actionable insights that can guide decision-making.
Techniques:
- Creating Reports: Summarizing findings in a structured format.
- Dashboards: Providing interactive visual summaries of data.
- Presentations: Communicating insights to stakeholders.
Challenges:
- Communicating Results: Making technical results understandable to non-technical stakeholders.
- Ensuring Relevance: Providing insights that are actionable and aligned with business goals.
Best Practices:
- Clear Visualizations: Use clear and accurate visual representations of data.
- Contextual Information: Provide background and context for insights.
7. Data Deployment
Data deployment involves integrating models into production environments where they can be used to make real-time decisions.
Process:
- Integration: Connecting the model with existing systems.
- Monitoring: Tracking model performance over time.
Challenges:
- Scalability: Ensuring the model can handle large volumes of data.
- Maintenance: Updating models as new data becomes available or business needs change.
Tools:
- Deployment Platforms: AWS SageMaker, Azure ML, Google AI Platform.
8. Feedback and Iteration
Feedback and iteration involve using feedback to refine models and processes, ensuring continuous improvement.
Process:
- Collecting Feedback: Gathering input from users and stakeholders.
- Making Adjustments: Updating models and processes based on feedback.
Challenges:
- Managing Change: Adapting to changes and new data.
- Continuous Improvement: Keeping models relevant and accurate over time.
Best Practices:
- Regular Reviews: Periodically reviewing and updating models and processes.
- Adaptation: Being flexible and responsive to new information and changing requirements.
Each of these stages is crucial for developing effective data-driven solutions and ensuring that they provide valuable insights and outcomes.
Read these articles:
- What is Certified Data Analyst Certification Course
- What is Certified Data Scientist Course
- What Is AI Engineer Course
Top Data Analytics Careers
Data analytics is a dynamic field with numerous career opportunities. Here are some of the top careers in data analytics:
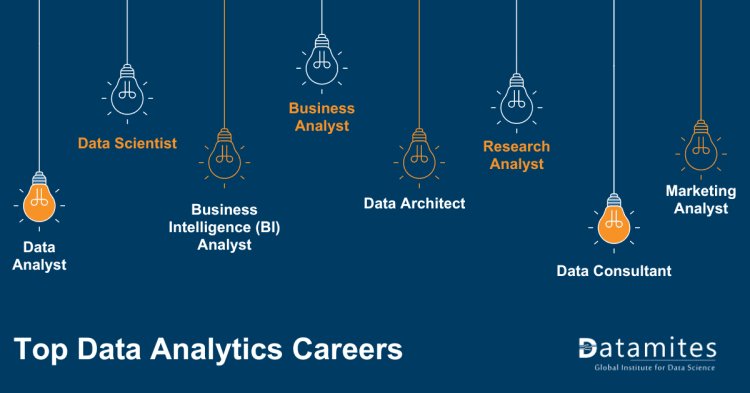
- Data Analyst: Collects, processes, and performs statistical analyses on data. Provides actionable insights through reports and visualizations, often using tools like Excel, SQL, or Python. The average annual salary of a Data Analyst varies by region, with estimates around ₹6,27,380 in India, £34,666 in the UK, and $78,060 in the USA. (Indeed)
- Data Scientist: Uses machine learning, statistical modeling, and advanced algorithms to analyze complex data sets. Works with large volumes of data and often uses tools such as R, Python, and various machine learning libraries. The average annual salary of a Data Scientist varies by country, with typical figures being approximately $123,039 in the USA, £51,198 in the UK, and ₹11,16,169 in India. (Indeed)
- Business Intelligence (BI) Analyst: Specializes in creating data visualizations and reports to help organizations understand business performance. Common tools include Tableau, Power BI, and Looker. The average annual salary for a BI Analyst is approximately ₹8,82,143 in India, £45,848 in the UK, and $1,34,774 in the USA. (Glassdoor)
- Business Analyst: Works closely with stakeholders to understand business needs and translates them into data requirements. They often bridge the gap between data teams and business units, using tools like SQL, Excel, and sometimes BI tools. The average annual salary of a Business Analyst varies by country: in India, it is approximately ₹8,50,000; in the UK, it is around £50,294; and in the USA, it is about $1,27,325. (Glassdoor)
- Data Architect: A Data Architect designs and manages the data infrastructure and systems, ensuring that data is stored, organized, and accessible efficiently. They use tools like SQL databases, data warehousing solutions, and ETL (Extract, Transform, Load) processes. The average annual salary for a Data Architect varies by location: in India, it's around ₹28,00,000; in the UK, approximately £82,333; and in the USA, about $1,80,888. (Glassdoor)
- Research Analyst: A Research Analyst conducts detailed research and analysis to support decision-making in various industries. This role often involves statistical analysis and trend identification, and may use tools like SPSS or SAS. In terms of salary, the average annual earnings for a Research Analyst are approximately $95,961 in the USA, £38,716 in the UK, and ₹6,00,000 in India. (Glassdoor)
- Data Consultant: A Data Consultant provides expert advice on data management, analytics strategies, and best practices, helping organizations optimize their data practices and improve decision-making processes. In terms of compensation, the average annual salary for a Data Consultant varies by region. In India, the average salary is approximately ₹10,75,005 per year. In the UK, a Data Consultant can expect to earn around £46,548 annually, while in the USA, the average salary is approximately $1,08,205 per year. (Glassdoor)
- Marketing Analyst: A Marketing Analyst focuses on analyzing marketing data to assess campaign performance, customer behavior, and market trends. They utilize tools like Google Analytics, social media analytics, and CRM systems. In terms of salary, the average annual earnings for a Marketing Analyst are approximately ₹5,26,174 in India (Indeed), £39,934 in the UK (Talent), and $65,763 in the USA (Indeed).
Refer these articles:
- What would be the Data Analyst Course Fee in India
- What would be the Data Science Course Fee in India
- What Would Be the Artificial Intelligence Course Fee in India
How Data Analytics Will Evolve
Data analytics is evolving rapidly, and several key trends are shaping its future. Here are some of the prominent ones:
- AI and Machine Learning Integration: Enhanced predictive analytics through advanced AI models and algorithms.
- Real-Time Analytics: Increased focus on processing and analyzing data instantly for faster decision-making.
- Big Data Expansion: Growth in data volume, variety, and velocity, necessitating more robust storage and processing solutions.
- Data Privacy and Ethics: Greater emphasis on securing data and addressing ethical concerns related to data usage.
- Automated Analytics: Automation tools simplifying complex data tasks and improving efficiency.
- Edge Analytics: Processing data closer to its source to reduce latency and bandwidth use.
- Data Visualization Innovations: More interactive and immersive visualization techniques for better insights.
These trends indicate a move towards more intelligent, efficient, and ethical handling of data.
The data analytics lifecycle is a comprehensive process that transforms raw data into valuable insights. From collection to actionable outcomes, each stage plays a crucial role in harnessing the power of data for strategic advantage. Embracing this lifecycle through a data analytics training can significantly enhance your ability to make data-driven decisions.
For those looking to dive deep into the world of data analytics, DataMites Institute is a prominent organization specializing in data science, artificial intelligence (AI), and analytics education and training. DataMites Institute offers a top-notch Data Analytics course featuring expert instructors and hands-on training. Students benefit from flexible learning options and receive industry-recognized certifications, including IABAC and NASSCOM FutureSkills. The program also includes career support services like resume building and job placement assistance. Enrolling in DataMites Institute course can significantly enhance your data-driven decision-making skills and career prospects.