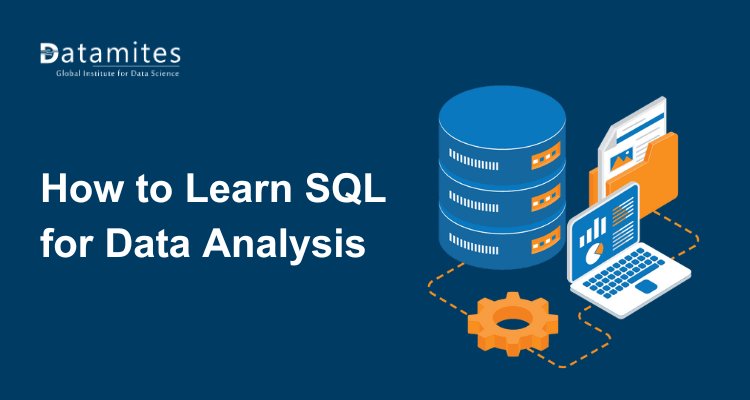
How to Learn SQL for Data Analysis
Discover how to learn SQL for data analysis with easy tutorials, key skills, and real-world use cases. Perfect for aspiring data analysts and beginners.
If you want to start a career in data analysis or upgrade your analytics skills, one of the first tools you must master is SQL. Whether it’s analyzing business performance, understanding customer behavior, or building dashboards SQL sits at the heart of data analysis.
Almost every company stores data in databases, and SQL is the language used to extract, clean, and understand that data. If you’re planning to become a data analyst or work in the data world, learning SQL is not optional it’s essential.
But the good news is: SQL is beginner-friendly, logical, and one of the fastest skills you can learn to get job-ready.
If you can write a sentence, you can write SQL.
In this guide, I’m going to walk you through the exact path I’d take if I were starting over today no fluff, no textbook theory, just the practical SQL for data analysis skills that actually get you paid.
What Is SQL and Why Is It Important for Data Analysis?
SQL (Structured Query Language) is a programming language used to communicate with databases. Whenever you want to retrieve data, update records, filter information, or perform analysis, SQL is the tool that helps you do it.
For data analysts, SQL is used to:
- Pull data from multiple tables
- Clean and transform raw data
- Perform aggregations (sums, averages, counts)
- Analyze trends
- Create reports and dashboards
- Support decision-making with data insights
In short, SQL for data analysis is like Excel on steroids faster, more powerful, and capable of handling millions of rows.
Most companies expect analysts to know SQL because:
- It is used in 90% of analytics teams
- Popular tools like Power BI, Tableau, and Python often rely on SQL
- Data analysts use SQL daily for analysis, reporting, and debugging data.
That’s why learning SQL is one of the best investments for your data career.
Refer to these articles:
Why SQL is Still the "Bread and Butter" (Even in 2025)
You might be thinking, "Shouldn't I just learn Python or use ChatGPT to write code for me?"
Here is the hard truth: Python is great, but SQL is what you will use 80% of the time.
According to the 2024 Stack Overflow Developer Survey, SQL is still used by over 50% of all developers and data professionals. Why? Because before you can analyze data in Python, visualize it in Tableau, or feed it into an AI model, you have to get the data. And that data lives in a database that speaks SQL.
Why SQL Is Essential for Data Analysts
1. High Demand & Career Value
- Data Science job-market research, SQL is cited in 52.9% of data analyst roles.
- Data analyst skills are among the fastest-growing, and SQL tops the list of in-demand technical skills. (Source: prepare.sh)
- Clearly, SQL proficiency is not optional for many analytics roles; it's a key requirement.
- Multiple studies show that SQL remains one of the most in-demand technical skills for data analysts. According to CDR Elite Writers’ global analysis, SQL was mentioned in 48.8% of data analyst job listings.
- In an academic study (Journal of Information Systems Applied Research), researchers found that SQL is the dominant tool required across job ads for business analysts, BI analysts, and data analysts even more so than many modern data tools.
2. Direct Access to Data
- Analysts often work with raw data stored in relational databases (MySQL, PostgreSQL, SQL Server, or cloud warehouses). SQL lets you query, filter, aggregate, and transform that data directly. As noted by NASSCOM, SQL helps you clean data, join multiple tables, and generate real-time business insights.
- This means you aren’t entirely dependent on automated ETL / BI tools; you can shape data as needed.
- According to a blog by LearnSQL.com, even as tools like machine learning, NoSQL, and AI grow, SQL is still used by 62% of data analysts and data scientists daily (based on their interpretation of developer surveys).
3. Efficiency and Flexibility
SQL allows quick operations on large datasets. Rather than exporting everything to spreadsheets, you can filter and transform the data at the source, run aggregations, and only pull what you need. Also, SQL integrates smoothly with BI tools (Tableau, Power BI) or with Python / R.
4. Reliability & Trustworthiness
Using SQL, you can standardize data cleaning and transformation. This gives you consistency, especially as a data analyst responsible for reporting. Business data analysts use SQL to automate reports, reduce manual errors, and create real-time, trustworthy dashboards. According to the DB-Engines Ranking, relational databases (which use SQL) are still extremely dominant. As of November 2025: Oracle, MySQL, Microsoft SQL Server, and PostgreSQL occupy top spots. (Source: db-engines.com)
Read to these articles:
- Exploratory Data Analysis
- Exploratory Data Analysis: Techniques and Tools
- Top statistical tools for data analysis
How to Learn SQL for Data Analysis (Step-by-Step Guide for Beginners)
Don't try to learn everything. SQL is massive, but for data analysis, you only need a specific subset of commands. I call this the "Pareto Principle of SQL" 20% of the commands give you 80% of the value.
Phase 1: The Basics (The "Excel Translation" Phase)
When I started, I mapped everything back to Excel. It made the transition much less painful.
- SELECT & FROM: This is just pointing to your spreadsheet. SELECT * FROM sales is literally "Open the Sales tab."
- WHERE: This is your filter. WHERE country = 'USA' is clicking the filter dropdown in Excel and unchecking everything except "USA".
- ORDER BY: This is your sort function.
Mentor Tip: The biggest mistake beginners make here is syntax panic. If you miss a comma, the computer yells at you. It’s normal. I still miss commas today.
Phase 2: Aggregation (The "Pivot Table" Phase)
This is where you start providing value. Your boss doesn't want a list of every sale; they want to know total sales by region. In Excel, you’d insert a Pivot Table. In SQL, you use GROUP BY.
SQL
SELECT
region,
SUM(sales_amount) as total_revenue
FROM sales
GROUP BY region;
Common Pitfall: I can't tell you how many times I've seen juniors write a query like this and get an error: SELECT region, sales_amount FROM sales GROUP BY region Error: Column 'sales_amount' must appear in the GROUP BY clause or be used in an aggregate function.
It’s confusing at first, but it just means: "You asked me to group by Region, but you didn't tell me what to do with the Sales Amount. Sum it? Average it? Count it?"
Phase 3: Joining Data (The "VLOOKUP" Phase)
Data never lives in one place. You’ll have a Users table and an Orders table. To connect them, you use JOINS.
- LEFT JOIN: The holy grail. It keeps everything from your main table and brings in matches from the second one. It is exactly like a VLOOKUP.
- INNER JOIN: Only keeps rows where there is a match in both tables.
My "War Story": Early in my career, I used a join on a table that had duplicate IDs. I didn't check my row counts. My resulting dataset exploded from 10,000 rows to 500,000 rows because of the duplicates (a "Cartesian product"). I reported that revenue was up 5,000% that month. It was embarrassing, but I never made that mistake again. Always check your row counts!
Phase 4: The Senior Skills (Window Functions & CTEs)
This is the stuff that gets you the "Senior" title (and salary).
- CTEs (Common Table Expressions): These simplify your code. Instead of writing a messy nested query, you use WITH to create a temporary table. It makes your code readable, which your future teammates will love you for.
- Window Functions: If you want to calculate a "Moving Average" or "Running Total," you can't easily do that with a standard GROUP BY. You need OVER (PARTITION BY...).
Setting Up Your Environment (Don't Get Stuck Here)
I see so many people quit before they type a single line of code because they can't get PostgreSQL installed on their laptop.
Don't install anything yet.
Start with a cloud-based tool or a simple local sandbox.
- Google BigQuery Sandbox: It's free, requires no installation (runs in your browser), and uses standard SQL.
- DB Fiddle: great for testing quick snippets.
- DBeaver: Once you are ready to install something locally, this is the best free universal database tool.
Refer to these articles:
- Data Science Vs Data Analytics
- Is AI Changing the Role of Data Analysts?
- Data Scientist vs ML Engineer vs AI Engineer
3 Real-World Project Ideas for SQL (To Build Your Portfolio)
You cannot learn data analysis with SQL just by watching videos. You need to get your hands dirty. Here are three project ideas that look great on a resume and use accessible data.
1. The eCommerce Cohort Analysis
The Data: Use the "Online Retail" dataset (available on Kaggle or UCI Machine Learning Repository). The Task: Don't just calculate total sales. Calculate retention.
- Write a query to group users by the month they made their first purchase (Cohort Month).
- Calculate what percentage of them returned to buy something in Month 2, Month 3, etc.
- Why this hires you: It shows you understand business metrics, not just code.
2. Website Traffic Funnel
The Data: Google Analytics 4 (GA4) sample dataset in BigQuery (search bigquery-public-data.ga4_obfuscated). The Task: specific event tracking.
- Count how many users hit the homepage.
- Count how many users viewed a product.
- Count how many users added to cart.
- Use a CTE to calculate the % drop-off at each step.
3. Employee Salary vs. Department Average
The Data: Use a sample HR database (like the classic "Employees" sandbox data). The Task: Use Window Functions.
- Calculate the average salary for each department.
- Write a query that lists every employee, their salary, and the difference between their salary and their department's average.
- Why this hires you: It proves you know OVER (PARTITION BY ...).
Common SQL Beginner Mistakes (That You Will Definitely Make)
Let’s normalize failing. You are going to see error messages. Here are the ones that tripped me up the most:
- The NULL Trap: You want to find users without an email address. You write: WHERE email = NULL Nothing happens. Why? Because in SQL, NULL isn't a value. It's the absence of a value. You can't equal "nothing." Fix: WHERE email IS NULL.
- Order of Operations (PEMDAS for SQL): You try to filter by a column you just created in the SELECT statement.
SQL
SELECT price * 0.9 as discounted_price
FROM products
WHERE discounted_price > 100 -- Error!
- The database processes the WHERE clause before it creates the SELECT columns. Fix: Use the original calculation in the WHERE clause or use a CTE.
- The Ambiguous Column: You join two tables that both have a column named id. SELECT id FROM users JOIN orders ... The database screams: "Which ID? User ID or Order ID?" Fix: Always use aliases: SELECT u.id, o.id FROM users u JOIN orders o…
Snowflake’s climb signals a broader shift toward analytics-optimized, cloud-based data warehouses. These systems combine the power of SQL with scalability and performance for large datasets.
Learning SQL for data analysts isn't about memorizing syntax; it's about solving puzzles.
Start small. Go to BigQuery right now, load a public dataset, and just try to count the rows. Once you see that number pop up on your screen, the fear goes away. You aren't "coding" you're finding answers.
And trust me, the first time you automate a report that used to take you 4 hours in Excel down to 4 seconds in SQL, you’ll never look back.
At DataMites, we take pride in helping learners build strong, future-ready careers in data analytics. Our Data Analyst Course in Bangalore is designed with real-world industry needs in mind, and Bangalore serves as our headquarters. We also offer physical classroom training across major cities including Mumbai, Delhi, Pune, Chennai, Hyderabad, Coimbatore, Ahmedabad, and more.
With over 150,000 learners worldwide, our mission has always been to deliver meaningful, hands-on learning experiences. Our expert-crafted curriculum, practical projects, and placement support ensure every learner gains confidence and job-ready skills. At DataMites, we are committed to guiding you every step of the way in your data analytics journey.