The Role of Statistics in Data Science
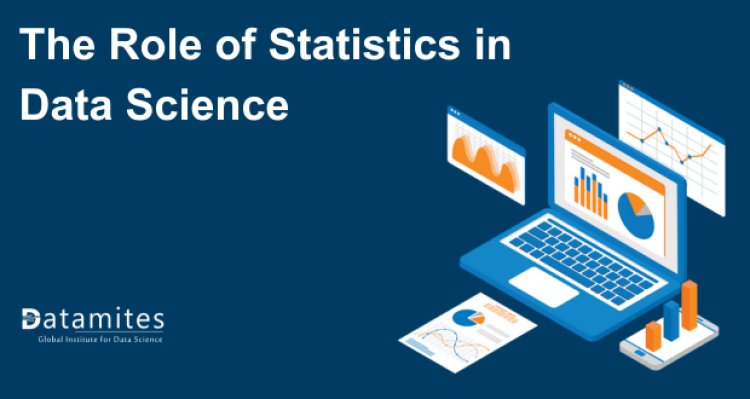
In an era where data is often hailed as the new oil, the role of statistics in data science becomes not just significant, but fundamental. With the global big data market projected to reach $103 billion by 2027, and the demand for data scientists growing at a staggering rate of 31% annually, the synergy between statistics and data science is undeniable. In this blog, we'll delve into how statistics underpin data science, enabling professionals to extract meaningful knowledge from vast amounts of information and drive impactful decisions. Buckle up as we explore how statistical methods and principles are crucial to mastering the art of data science.
Understanding Statistics and Data Science
Definition and Scope of Statistics
Statistics is a branch of mathematics dedicated to collecting, analyzing, interpreting, presenting, and organizing data. It employs a range of methods to uncover patterns, derive insights, and make informed decisions based on data.
Statistics covers a broad range of critical areas, including:
- Data Collection: Gathering information through surveys, experiments, observational studies, and administrative data is crucial for accurate analysis.
- Data Analysis: Analyzing, purifying, transforming, and modeling data to uncover insights, employing methods such as exploratory data analysis (EDA) and confirmatory data analysis (CDA).
- Data Interpretation: Drawing conclusions and making decisions based on analysis, considering the data's context and implications.
- Data Presentation: Communicating findings clearly through tables, charts, graphs, and reports to summarize key results.
- Probability Theory: Providing a mathematical foundation for inferential statistics, focusing on the likelihood of outcomes and understanding random phenomena.
- Statistical Modeling: Creating mathematical models to represent relationships within data for prediction, classification, and pattern recognition.
Definition and Scope of Data Science
Data science encompasses a broader scope than statistics. It integrates techniques from statistics, computer science, and domain-specific knowledge to handle large volumes of data and extract valuable insights. Data science is a broad and rapidly evolving field with a wide range of applications. Its scope includes:
- Data Collection and Acquisition: Collecting information from diverse origins such as databases, APIs, web scraping techniques, and sensors.
- Data Cleaning and Preprocessing: Handling missing values, outliers, and inconsistencies to prepare data for analysis.
- Exploratory Data Analysis (EDA): Employing statistical methods and visualization tools to uncover and interpret patterns and relationships within data.
- Feature Engineering: Creating new features or refining current ones to boost the model's performance.
- Statistical Analysis and Modeling: Applying statistical methods and building models to infer relationships, test hypotheses, and make predictions.
- Machine Learning and Artificial Intelligence: Developing algorithms and models that can learn from data and make automated decisions or predictions.
Refer these articles:
Importance of Statistics in Data Science
Statistics is indeed the backbone of data science. It offers both the conceptual groundwork and hands-on resources required for gathering, analyzing, interpreting, and presenting data. Here’s a detailed look at the importance of statistics in data science:
Data Collection and Analysis:
- Systematic Approach: Statistics ensures that data is collected systematically and accurately. This involves designing surveys, experiments, and observational studies that minimize bias and maximize the reliability of the data.
- Descriptive Statistics: Techniques such as mean, median, mode, variance, and standard deviation help summarize and describe the main features of a dataset, providing a quick overview of the data.
Model Building and Evaluation:
- Hypothesis Testing: Statistical tests (e.g., t-tests, chi-square tests) help determine if the results observed in a dataset are statistically significant or if they occurred by chance.
- Regression Analysis: Techniques like linear regression, logistic regression, and polynomial regression are used to model relationships between variables and make predictions.
- Validation: Statistical methods such as cross-validation, bootstrapping, and confidence intervals are used to evaluate the performance and reliability of models, ensuring they generalize well to new data.
Decision Making:
- Inferential Statistics: Techniques such as confidence intervals, margin of error, and p-values help data scientists make inferences about a population based on a sample, enabling more informed decision-making.
- Risk Assessment: Statistical analysis helps quantify the risk associated with different decisions, allowing for better risk management and more informed strategic planning.
- Optimization: Statistics is used in optimization techniques, such as A/B testing, to identify the best strategies and practices by comparing different options.
Key Statistical Techniques in Data Science
In data science, statistical techniques are crucial for analyzing data, making predictions, and deriving insights. Here are some key statistical techniques used in data science:
1. Descriptive Statistics
- Mean, Median, Mode: Measures of central tendency.
- Variance, Standard Deviation: Measures of spread or dispersion.
- Skewness, Kurtosis: Measures of the shape of the data distribution.
- Percentiles, Quartiles: Measures of relative standing.
2. Inferential Statistics
- Hypothesis Testing: Used to make inferences or draw conclusions about a population based on sample data. Includes tests like t-tests, chi-square tests, and ANOVA.
- Confidence Intervals: A set of values employed to approximate a population parameter.
- p-Value: Probability of observing the results given that the null hypothesis is true.
3. Regression Analysis
- Linear Regression: Analyzes how one or more independent variables influence a dependent variable.
- Logistic Regression: Used for binary classification problems.
- Polynomial Regression: Expanding linear regression to account for non-linear relationships.
- Ridge and Lasso Regression: Techniques to handle multicollinearity and feature selection.
4. Classification Techniques
- k-Nearest Neighbors (k-NN): Determines the category of a data point by identifying the most common class among its k closest neighbors.
- Support Vector Machines (SVM): Identifies the optimal hyperplane that most effectively divides the classes within the feature space.
- Decision Trees and Random Forests: Models that utilize tree structures for tasks involving classification and regression.
5. Clustering Techniques
- k-Means Clustering: Group data into k separate clusters based on the similarity of their features.
- Hierarchical Clustering: Builds a hierarchy of clusters either via a bottom-up or top-down approach.
- DBSCAN (Density-Based Spatial Clustering of Applications with Noise): Identifies clusters based on the density of points.
6. Dimensionality Reduction
- Principal Component Analysis (PCA): It simplifies data by converting it into a new set of variables that preserve the majority of the original variance.
- t-Distributed Stochastic Neighbor Embedding (t-SNE): A technique for reducing dimensions in a non-linear fashion to visualize complex, high-dimensional datasets.
- Linear Discriminant Analysis (LDA): Finds a linear combination of features that best separates two or more classes.
7. Time Series Analysis
- ARIMA (AutoRegressive Integrated Moving Average): Models time series data for forecasting.
- Exponential Smoothing: Uses weighted averages of past observations to make forecasts.
- Seasonal Decomposition of Time Series (STL): Breaks down a time series into its seasonal, trend, and residual parts.
8. Bayesian Statistics
- Bayesian Inference: Uses Bayes' theorem to update the probability of a hypothesis as more evidence becomes available.
- Naive Bayes Classifier: Simplistic probabilistic classifier based on applying Bayes' theorem with strong independence assumptions.
9. Resampling Techniques
- Bootstrap: Generates multiple samples from the original dataset to estimate the sampling distribution.
- Cross-Validation: Splits the data into multiple training and testing sets to evaluate model performance.
10. Survival Analysis
- Kaplan-Meier Estimator: Assesses the survival function based on duration data.
- Cox Proportional-Hazards Model: Models the hazard rate for time-to-event data, accounting for covariates.
11. Multivariate Statistics
- Multivariate Analysis of Variance (MANOVA): Extension of ANOVA for multiple dependent variables.
- Canonical Correlation Analysis (CCA): Explores relationships between two sets of variables.
These techniques are fundamental to performing robust data analysis and developing predictive models in various domains of data science.
Refer these articles:
- What is Certified Data Scientist Course?
- What is Datamites Certified Data Analyst Certification
- What Is AI Engineer Course?
Role of Statistics in Data Science
The role of statistics in data science is fundamental, as it provides the methods and techniques needed to analyze, interpret, and make decisions based on data. Here’s an overview of how different statistical concepts fit into data science:
Data Collection and Cleaning
1. Sampling Methods: These methods ensure that the data collected is representative of the population.
- Random Sampling: Every member of the population has an equal chance of being selected, which helps in achieving a representative sample.
- Stratified Sampling: The population is divided into subgroups (strata) based on a characteristic, and samples are drawn from each subgroup. This technique improves precision by ensuring all relevant subgroups are represented.
2. Identifying and Handling Outliers:
- Outlier Detection: Methods such as z-scores, IQR, or visual inspection (box plots) help in identifying data points that deviate significantly from others.
- Data Cleaning: This involves addressing outliers, missing values, and inconsistencies to ensure the data's quality and reliability.
Exploratory Data Analysis (EDA)
1. Techniques for Summarizing and Visualizing Data:
- Histograms: Show the frequency distribution of a dataset, helping to understand its distribution.
- Scatter Plots: Reveal relationships between two variables.
- Correlation Analysis: Assesses the intensity and orientation of connections between variables, typically employing Pearson or Spearman correlation coefficients.
Model Selection and Validation
Statistical Methods for Model Evaluation:
- Cross-Validation: A method for evaluating the applicability of statistical analysis outcomes to new, independent datasets involves dividing the data into different segments. This technique entails training the model on some of these segments and testing it on the remaining ones.
- AIC/BIC: Criteria for model selection that balance the goodness of fit with model complexity. AIC (Akaike Information Criterion) and BIC (Bayesian Information Criterion) are tools used to determine the best-fitting model from a selection of candidates.
Predictive Modeling
1. Regression Analysis:
- Linear Regression: It describes how a dependent variable relates to one or more independent variables by constructing a linear equation to fit the data.
- Logistic Regression: Applied in binary classification tasks, this method forecasts the likelihood of one of two possible outcomes.
2. Classification Algorithms:
- Decision Trees: Models that split the data into subsets based on feature values, leading to a tree-like structure for classification or regression.
- Random Forests: An ensemble method that combines multiple decision trees to improve performance and control overfitting.
Decision Making
Statistical Inference for Business Decisions:
- Informed Decision Making: Using statistical analyses to guide business strategies, such as understanding market trends, customer behavior, and operational efficiencies.
- Risk Assessment and Uncertainty Quantification: Evaluating potential risks and uncertainties by modeling possible outcomes and their probabilities, aiding in more informed and strategic decision-making.
Statistics provides the foundational tools for making sense of data, building predictive models, and deriving actionable insights, which are crucial for effective data science and informed decision-making.
Read these articles:
Applications of Statistics in Data Science
Statistics is fundamental to data science, underpinning both analysis and decision-making with essential insights. Here’s a breakdown of its applications in the areas you mentioned:
Predictive Modeling
Building and Validating Models:
- Statistical Methods: Techniques such as regression analysis, hypothesis testing, and Bayesian inference help in creating and refining predictive models. They enable the analysis of how variables interrelate and facilitate predictions based on data insights.
- Model Evaluation: Methods like cross-validation, bootstrapping, and residual analysis are used to assess the performance and reliability of predictive models. These methods aid in assessing the model's ability to generalize to fresh, unfamiliar data.
Data Visualization
Role of Statistical Graphics:
- Interpreting Data: Statistical graphics such as histograms, scatter plots, and box plots help in summarizing and interpreting data. They provide insights into data distributions, central tendencies, and variability.
- Identifying Patterns: Visualization tools like heatmaps, time-series plots, and interactive dashboards help in spotting trends, patterns, and anomalies that might not be obvious from raw data alone.
Machine Learning
Statistical Foundations:
- Algorithm Development: Many machine learning algorithms, such as linear regression, logistic regression, and support vector machines, are based on statistical principles. Understanding these principles is key to developing and applying these algorithms effectively.
- Model Validation: Statistical methods are used to evaluate the robustness and generalizability of machine learning models. Techniques like k-fold cross-validation and confusion matrices help in assessing model performance and ensuring that it performs well on new data.
Quality Control and A/B Testing
Optimizing Processes:
- Statistical Methods: Techniques such as statistical process control (SPC) and design of experiments (DOE) are used to monitor and improve processes. They help in identifying factors that influence process performance and in making data-driven improvements.
- A/B Testing: This method involves comparing two versions of a product or process to determine which performs better. Statistical significance testing, such as t-tests or chi-squared tests, is used to ensure that observed differences are not due to random chance.
Statistics provides the tools and methods necessary for building, validating, and optimizing models, interpreting and visualizing data, and ensuring quality and effectiveness in processes and products.
Grasping the significance of statistics is crucial for anyone aspiring to build a career in data science. Statistics not only provides the necessary tools and methodologies for data analysis but also ensures that the insights and conclusions drawn are valid, reliable, and actionable. As data science continues to evolve, the importance of a strong foundation in statistical principles will only grow, making it an indispensable part of the data scientist’s toolkit.
DataMites Institute is a leading educational organization specializing in data science, artificial intelligence, and data analytics. It offers industry-recognized certifications accredited by IABAC and NASSCOM FutureSkills, greatly enhancing employability.
DataMites training institute provides comprehensive training in Statistics for Data Science, equipping learners with essential skills and knowledge to excel in the field. Additionally, the institute offers a diverse range of programs, including Certified Data Scientist, Python for Data Science, Data Science with R, and a Diploma in Data Science Training. Each program is designed to cater to various learning needs and career objectives.

