A Complete Guide to Logistic Regression Algorithm in Python
Understanding the Etymology:
Among the various statistical techniques employed in supervised learning, perhaps the most basic notion of a model is conveyed by linear regression. Model creation could not get any simpler. The input and output fit onto a linear equation that can best represent the relationship between the predictor and response variables. Continuous target variables can thus be estimated by the model function.
When we are faced with a classification problem, however, a similar function needs to be modified so as to compute the relative probability of occurrence for each of the classes concerned. And for reasons we shall see, it works out better to obtain a measure of the log of the probability. The output of such a function would remain continuous in nature, not unlike regression. There are further steps to handle these probability values and arrive at the target variable but the foundation of the classification model is laid right here. And since the idea of a base relationship (in the form of logit or logistic function) borrows liberally from linear regression, it is called logistic regression.
Classification as a working problem:
Classifying deals with just about any working issue related to business, industrial output, education and medicine. Essentially we might be looking at fault identification, performance or efficiency levels, sales and marketing conversions, product reviews, customer feedback, and so on and so forth. We are looking at binary classification if there is an either-or system of labelling, for example, yes or no; red or green; converted or not; good or bad. If there is a hierarchy in terms of the classification labels, for example, satisfaction rating for a product or service, class categories for an airline or a train; we may be looking at multiclass classification.
Refer this article to know: Support Vector Machine Algorithm (SVM) – Understanding Kernel Trick
Logit or Logistic function:
In order to have input variables converted to the log of odds for the occurrence of a certain class, the probabilities must range from 0 to 1. This conversion happens with the Sigmoid function.
The function is defined with the output f(x) as follows:
f(x) = 1 / [1+e^(-x)]
The figure denotes the representation of a Sigmoid function.
If we take a look at the elementary case of binary outputs, we only have two classes. To put it in numerical form, the dependent variable which is being computed can only be expressed as 0 or 1.
However, that is not the direct result we procure from the sigmoid function applied to the predictor variables. As seen in the figure, we have an ‘S’ curve that is steep in the mid-range and gradually tapers off at the ends. Note that the end values stop short of committing to the binary options of 0 and 1. As expected the entire function falls in the range (0,1).
Read this article: A Comprehensive Guide to K-Nearest Neighbor (KNN) Algorithm in Python
Threshold value:
For our purpose of binary classification, we must quantify the probability value obtained with the help of a designated threshold value. This basically becomes the barrier between the two classes – anything that falls below the threshold must be 0, and any value that is over and above the threshold is classified as 1. The delineating boundary is predefined and clearly distinguishes between the two classes allowing us to predict the response variable.
The Cost Function:
The Cost function represents the penalty or the cost that must be borne if a prediction goes wrong.
Cost(hθ(x),y)=-ylog(hθ(x))-(1-y)log(1-hθ(x))
The equation represents the cost for binary classification. The goal of the algorithm in machine learning would be to minimise the cost function as much as possible.
What is S-Curve or Sigmoid Curve

Implementation in Python:
import pandas as pd # for reading the file
import numpy as np # to obtain mean median etc
from sklearn.preprocessing import StandardScaler # for scaling the data
from sklearn.linear_model import LogisticRegression # importing logistic regression
from sklearn.model_selection import train_test_split # for splitting the data into training and testing
from sklearn.metrics import accuracy_score, confusion_matrix, roc_curve, roc_auc_score #metrics to check model performance
import matplotlib.pyplot as plt # visualization library, analysis of data
import seaborn as sns # visualization library, analysis of data
%matplotlib inline
Dataset:
# The dataset shows the impact of certain features on the diabetic condition of a person.
# We are required to predict if a person has diabetes.
data = pd.read_csv(“/content/diabetes1.csv”) # Reading the Data
data.head()
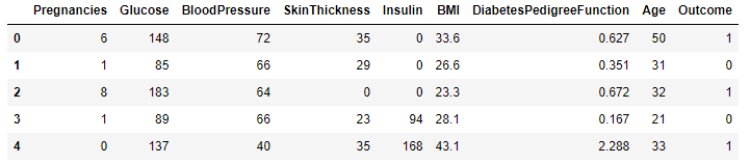
# Here we see various input features like blood pressure, age and BMI that influence diabetes.
Also refer: K-Nearest Neighbor (KNN) Algorithm in Machine Learning using Python
Steps to perform in Feature engineering/data preprocessing include:
- Check for missing values. Check for corrupted values if any.
- Convert categorical variables into numerical.
- Handling of outliers.
- Scaling the data.
- Transformation of data.
- Balancing the data.
# Once preprocessing is complete we perform feature selection with the help of a heatmap.
sns.heatmap(data.drop(‘Outcome’,axis=1).corr(),annot=True) # checking for correlation
# If input features are not highly correlated with each other we may retain all, as happens to be the case here. Else we can get rid of a few features that are redundant in analysis and model performance.
ROC Curve and AUC Score

Model Creation:
# Defining X and y and creating dependent and independent variables
X = data.drop(columns = [‘Outcome’]) ## independent variable
y = data[‘Outcome’]
## Scaling is needed to make sure all numerical features have the same magnitude. As if we pass varying magnitude to the algorithm, high chances are there algorithm will give importance to features which have high magnitude.
from sklearn.preprocessing import StandardScaler
scalar = StandardScaler() # object creation
X_scaled = scalar.fit_transform(X) # scaling independent variables
# creating training and testing data
from sklearn.model_selection import train_test_split
x_train,x_test,y_train,y_test = train_test_split (X_scaled,y, test_size= 0.25,random_state = 355)
#splitting data into train and test
# Model creation
from sklearn.linear_model import LogisticRegression
log_reg = LogisticRegression() # object creation of logistic regression
log_reg.fit(x_train,y_train) # training model with training data
y_train_pre=log_reg.predict(x_train) # predicting y_train
Model Evaluation:
# calculating accuracy
from sklearn.metrics import accuracy_score,confusion_matrix,precision_score,recall_score,f1_score,classification_report
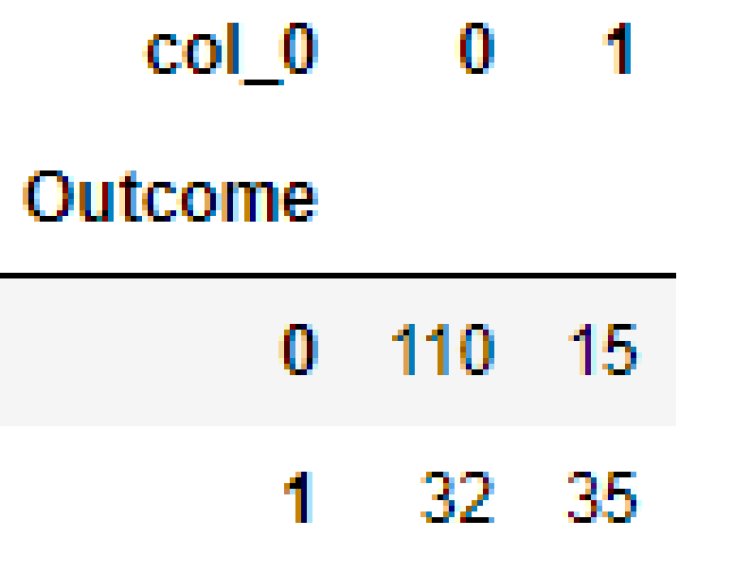
# confusion matrix
pd.crosstab(y_test, y_pred)
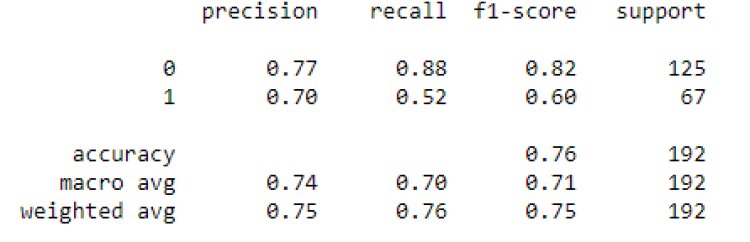
report=classification_report(y_test, y_pred) # it will give precision,recall,f1 scores and accuracy
print(report)
What is One Hot Encoding

Let us look at how the evaluation is interpreted.
For the classification problem, evaluation consists of looking at the precision or recall or even both, depending on the project case. Parameters like accuracy give us a holistic view, yet fail to capture certain essential insights into the data. We prefer to look at a combined impact of the precision and recall delivered by a parameter called the f1 score.
The confusion matrix arising from our model evaluation summarizes the results quite succinctly.
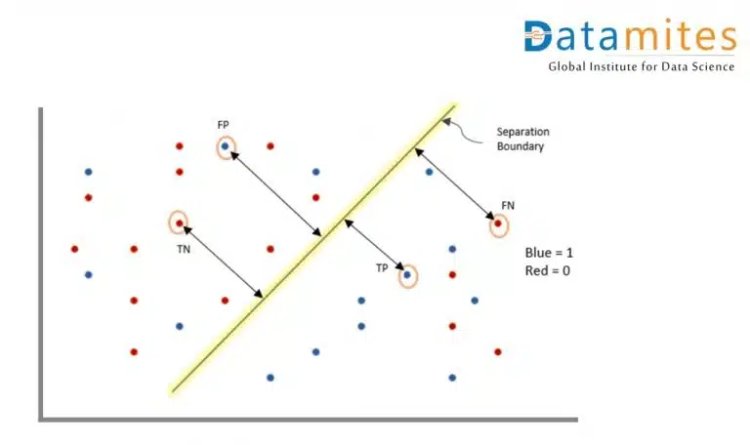
Figure 1: The figure depicts parameters within the confusion matrix during evaluation.
We have the following observations based on the predicted classifications tallied alongside the actual classifications:
True Positive (TP): The actual class 1 being predicted truly/correctly as 1
True Negative (TN): The actual class 0 being predicted truly as 0
False Positive (FP): The actual class 0 being predicted as 1
False Negative (FN): The actual class 1 being predicted as 0
The summary of the above is represented in the confusion matrix.
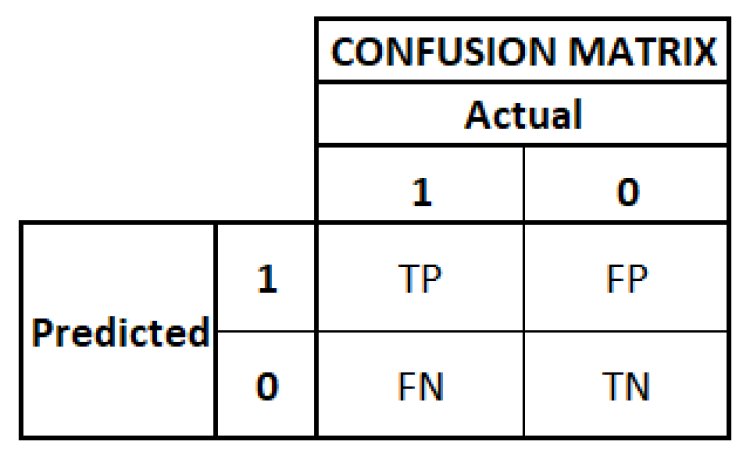
Figure 2: The figure shows the confusion matrix as part of the evaluation
Recall, also known as Sensitivity, refers to the proportion of actual positive cases that were correctly predicted, given as TP/ (TP+FN). Say if we are predicting an illness, we would be particularly interested in the wrong diagnosis where the patients have actually contracted the illness. We’d thus seek to reduce the number of FN or false negative cases.
For the current example of predicting diabetes, we have a low recall for those who actually have diabetes in the test dataset. The logistic model may not be most suitable in this instance.
Precision refers to the proportion of positive predictions that were actually positive; given by TP/(TP+FP). Say if we are proclaiming a party as guilty or innocent, we would be more worried about coming up with the wrong verdict for someone who’s actually innocent. In this case, we’d look to minimize the false positives.
Accuracy really looks at the entirety of the matrix and gives us the proportion of total correct predictions delivered by the model. In other words, (TP+TN)/ (TP+FN+FP+TN).
It is more convenient to have the best recall and precision than look at the accuracy. For this reason, we look at the f1 score. The f1 score is defined as the harmonic mean of the precision and the recall, given by
f1 score = 2PrecisionRecall / (Precision + Recall)
Say a firm is launching a new product in the market and would like to not only find out how many customers find the novelty useful but also inculcate into future plans how many of their customers or new prospects did not take to the product and preferred something different. The f1 score then becomes a handy tool for evaluation.
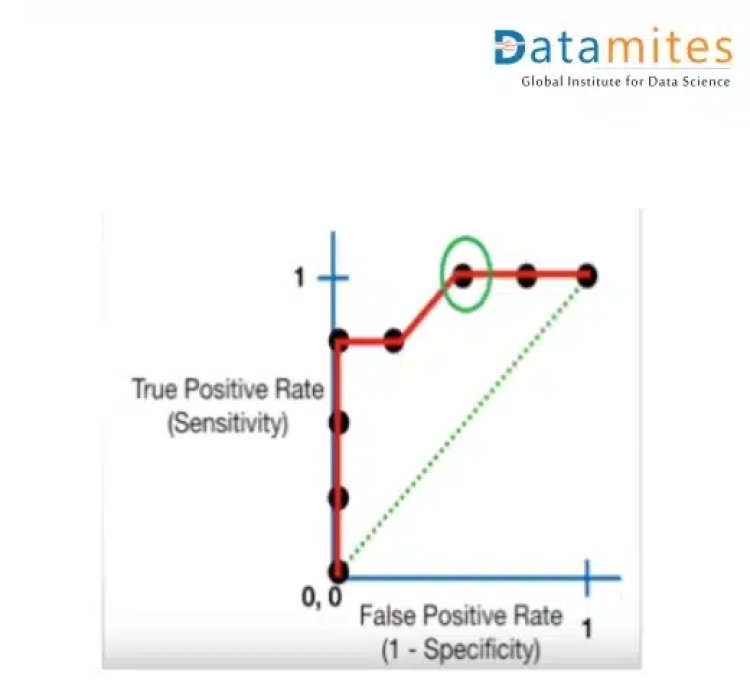
ROC Curve:
In real life, we create various models using different algorithms that we can use for classification purposes. To decide the model to utilise for a specific dataset, we use AUC. Suppose we have created Logistic regression, SVM as well as a clustering model for classification purposes. We will calculate AUC for all the models separately. The model with the highest AUC value will be the best model to use.
from sklearn.metrics import roc_auc_score,roc_curve # used to compare multiple models
probs=log_reg.predict_proba(x_test)[:,1]
auc = roc_auc_score(y_test, probs) # roc curve
print(‘AUC: %.2f’ % auc)
Conclusion:
The logistic regression model is considered prominent for classification problems in machine learning that have a more or less well-delineated class structure. In other words, it helps if the data are linearly separable. As the problem becomes complex we tend to look at alternate models such as Support Vector Machines, Decision Trees et al. The techniques of bagging and boosting also come into play for reducing training issues within the model.
Being a prominent data science institute, DataMites provides specialised training in topics including machine learning, deep learning, artificial intelligence, the internet of things. Our python Courses at DataMites have been authorised by the International Association for Business Analytics Certification (IABAC), a body with a strong reputation and high appreciation in the analytics field.
What is Cross Entropy