Advanced Tips and Tricks for Microsoft Power BI Users
Discover advanced Power BI tips and tricks to enhance your data visualization, optimize performance, and create dynamic reports. Learn expert techniques to maximize efficiency and unlock deeper business insights.
Power BI is a tool for data analysis and visualization. In this article, we’ll delve into Advanced Tips and Tricks for Microsoft Power BI Users. These tips will help you get more out of your data and make your reports more insightful and compelling. Whether you’re a beginner or an experienced user, these techniques will enhance your Power BI skills and allow you to create more impactful visualizations. Let’s explore how to leverage Power BI to its fullest potential.
Unlocking Data Insights with Power BI
Power BI, developed by Microsoft, is a user-friendly tool for businesses to analyze data effectively. It simplifies the creation of interactive reports and dashboards, enabling users to visualize insights effortlessly. Compatible with various data sources like spreadsheets and databases, Power BI streamlines data analysis processes. Its seamless integration with Microsoft products enhances usability.
According to Accenture‘s 2020 findings, just 27% of business executives reported that their data and analytics projects generate actionable insights. However, Power BI stands out as an exceptional solution to address this challenge. With its user-friendly interface and powerful analytics capabilities, Power BI empowers organizations to transform raw data into meaningful insights.
By enabling users to create interactive reports and dashboards, Microsoft Power BI facilitates data visualization and interpretation. Its seamless integration with various data sources further enhances efficiency in analysis. Therefore, leveraging Power BI can significantly improve the likelihood of turning data into actionable insights, driving informed decision-making across businesses.
Moreover, Power BI ensures data security through STS (Security Token Service), which controls access and protects sensitive information. STS strengthens data integrity by regulating permissions and encryption, instilling confidence in users regarding data confidentiality. With Power BI and STS, businesses can harness the power of data while maintaining robust security measures.
Refer these below articles:
- Mastering Microsoft Power BI: A Guide for Beginners
- Top Features of Power BI for Effective Data Analysis
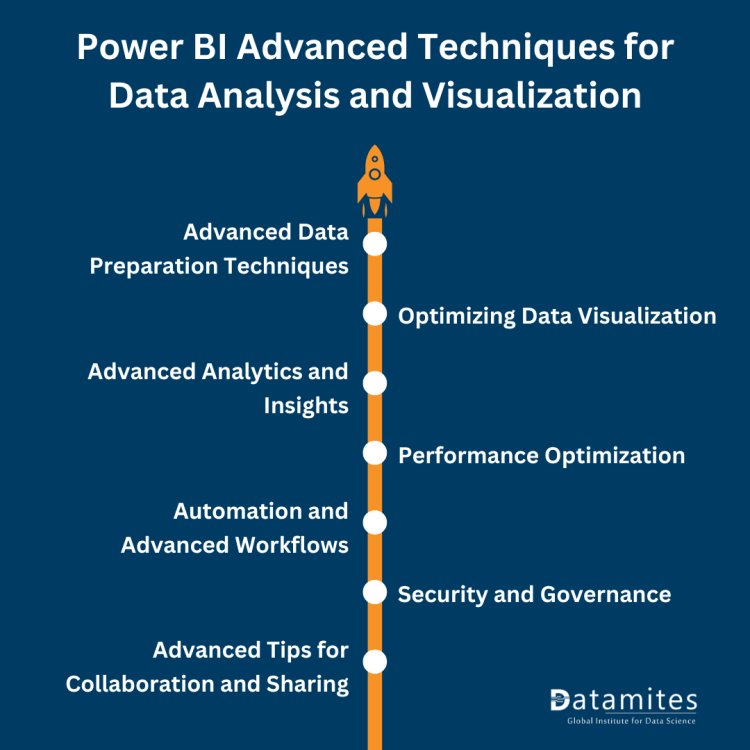
Mastering Power BI: Advanced Techniques for Data Analysis and Visualization
1. Advanced Data Preparation Techniques
In advanced data preparation, employing sophisticated data cleansing methods is crucial. Utilizing DAX expressions within Power BI enables complex transformations, allowing users to manipulate data effectively. Additionally, leveraging the M language offers customization for data transformations and modeling, ensuring tailored solutions to specific requirements. Addressing outliers and anomalies involves employing advanced techniques to detect and handle such data points effectively, ensuring data accuracy and reliability.
2. Optimizing Data Visualization
Advanced visualization techniques in Power BI include custom visuals, themes, and conditional formatting, enhancing the aesthetics and functionality of reports. Integration of custom JavaScript visuals caters to unique visualization needs, offering flexibility and creativity. Creating complex interactive dashboards with features like bookmarks and drill-through enhances user engagement and facilitates deeper data exploration.
3. Advanced Analytics and Insights
Exploring advanced analytical functions and calculations through DAX empowers users to derive deeper insights from data. Implementing predictive analytics and forecasting models within Power BI enables proactive decision-making based on future trends. Integration of machine learning algorithms and R/Python scripts further enhances analytical capabilities, enabling advanced analysis and prediction.
4. Performance Optimization
Optimizing report performance involves strategies such as refining DAX queries and simplifying data models to enhance efficiency. Techniques for optimizing report rendering and reducing load times ensure smooth user experiences, particularly with large datasets. Best practices for managing complex data pipelines and orchestrating data refresh processes streamline operations and ensure timely insights.
5. Automation and Advanced Workflows
Automation using Power Automate enables scheduling and refreshing reports, improving efficiency and ensuring up-to-date insights. Integrating Power BI with other tools and platforms through APIs facilitates advanced workflows, enhancing productivity and collaboration. Tips for managing complex data pipelines and orchestrating data refresh processes ensure seamless operations.
6. Security and Governance
Implementing advanced security features like row-level security and dynamic security roles ensures data confidentiality and integrity within Power BI. Best practices for data governance policies guarantee compliance with regulations like GDPR, fostering trust and accountability.
7. Advanced Tips for Collaboration and Sharing
Exploring advanced sharing options such as embedding reports in custom applications and websites extends the reach of insights to broader audiences. Techniques for managing and collaborating on reports within teams or organizations facilitate seamless communication and knowledge sharing. Leveraging advanced features for distributing reports ensures stakeholders receive relevant insights effectively.
Read the below articles:
Final Note
We’ve explored advanced techniques for mastering Power BI, empowering users to elevate their data analysis and visualization skills. From advanced data preparation methods to optimizing visualization and analytics, each section offered valuable insights for maximizing Power BI’s potential.
DataMites Training Institute offers a globally accredited Power BI course, empowering professionals with advanced data visualization and analytics skills. With expert-led training and hands-on projects, learners master data modeling, DAX, and dashboard creation for real-world applications. Recognized among India's top analytics institutes, DataMites delivers industry-relevant education for career advancement. Excel in data-driven decision-making with Power BI training from DataMites!
For further learning, consider exploring additional resources or training opportunities to deepen your understanding and proficiency. DataMites, a global institute accredited by IABAC, provides comprehensive in Power BI Training and other data analytics tools, facilitating continuous growth and expertise in this dynamic field.