Correlation vs Causation: What Data Analysts Need to Know
Understand correlation vs causation with practical examples, statistical methods, confounding variables, and actionable insights for data analysts.
 Kriti Maurya
In data analytics, identifying relationships between variables helps businesses discover patterns, evaluate performance, and make informed decisions. However, one of the most important statistical principles analysts must understand is the difference between correlation and causation.
For example, ice cream sales and swimming-related accidents may both increase during summer. Although these variables are associated, it does not mean that buying ice cream causes swimming accidents. Warmer weather and increased outdoor activity may influence both.
Misinterpreting such relationships can lead to ineffective marketing campaigns, misleading research findings, and costly business decisions. Understanding correlation vs causation helps data analysts distinguish statistical associations from genuine cause-and-effect relationships.
This guide explains the difference between correlation and causation, explores practical examples, demonstrates how to interpret data, and introduces the methods analysts use to investigate causal relationships.
What is Correlation in Statistics?
Correlation describes the statistical relationship between two variables. It indicates whether they tend to change together and, depending on the measure used, how strongly they are associated.
However, correlation used in data science alone does not establish that one variable causes a change in another.
There are three common patterns of linear correlation.
1. Positive correlation
A positive correlation occurs when two variables tend to increase or decrease together.
Example: A company may observe that advertising expenditure and website traffic increase during the same periods. This indicates a positive association, although additional analysis is needed to determine whether advertising caused the increase in traffic.
2. Negative correlation
A negative correlation occurs when one variable tends to increase as the other decreases.
Example: Product prices and customer demand may move in opposite directions, particularly when other market conditions remain comparable. However, the relationship may change depending on competition, customer preferences, and product availability.
3. Zero correlation
Zero correlation means that there is no linear association between two variables as measured by the Pearson correlation coefficient.
It does not necessarily mean that the variables are unrelated. A strong nonlinear relationship may exist even when their Pearson correlation is zero.
Understanding the Pearson Correlation Coefficient
The Pearson correlation coefficient, represented by r, measures the direction and strength of a linear relationship between two quantitative variables. Its value ranges from −1 to +1.
| Pearson correlation coefficient | Interpretation |
| +1 | Perfect positive linear correlation |
| Between 0 and +1 | Positive linear correlation |
| 0 | No linear correlation |
| Between −1 and 0 | Negative linear correlation |
| −1 | Perfect negative linear correlation |
For example, suppose an analyst calculates a Pearson correlation coefficient of +0.85 between advertising expenditure and website traffic. This indicates a strong positive linear association in the observed data.
It does not prove that increasing advertising expenditure caused traffic to rise. Seasonal demand, brand awareness, changes in search traffic, or other marketing activities could also influence the result.
The coefficient should therefore be interpreted alongside a scatter plot, knowledge of the data collection process, and the business context.
Refer to the articles below:
- Top 5 Emerging Trends in Data Analytics
- Data Preparation for Data Analysis
- Introduction to ETL in Data Analytics
What Is Causation in Data Analysis?
Causation refers to a cause-and-effect relationship in which changing one variable produces a change in another under specified conditions.
Consider an e-commerce company that redesigns its checkout process to reduce cart abandonment. If a properly conducted experiment shows that customers randomly assigned to the redesigned checkout complete purchases more frequently than customers assigned to the original version, the results provide evidence that the redesign improved conversion rates.
Causal analysis asks a more specific question than correlation analysis:
What would happen to the outcome if we changed one factor, compared with what would have happened without that change?
This question is central to business analytics because organizations often need to evaluate the effects of interventions rather than simply identify patterns.
Examples include:
Determining whether a discount increases purchases.
- Measuring whether a training program improves employee performance.
- Evaluating whether a website redesign increases conversions.
- Assessing whether a customer retention campaign reduces churn.
- Investigating whether a new product feature improves customer engagement.
Establishing causation requires appropriate evidence and assumptions. Analysts must consider confounding variables, selection bias, measurement quality, and the suitability of the research design before drawing causal conclusions.
Correlation vs Causation: Key Differences for Data Analysts
The main difference between correlation and causation is whether the available evidence supports a cause-and-effect relationship.
| Factor | Correlation | Causation |
| Meaning | Statistical association between variables | A change in one factor produces a change in another |
| Primary purpose | Identify patterns and relationships | Estimate the effect of an intervention or exposure |
| Evidence | Correlation coefficients, scatter plots, and statistical analysis | Randomized experiments or credible causal inference methods |
| Confounding | An observed relationship may reflect other variables | Potential confounders must be addressed through study design or analysis |
| Example | Advertising expenditure and sales increase together | A randomized experiment shows that an advertising campaign increases sales |
| Business application | Exploring customer behavior | Evaluating marketing strategies and business interventions |
Key takeaway: Correlation identifies relationships, while causal analysis investigates whether changing one factor produces a change in another. Correlation does not imply causation. Earlier Correlation vs Covariance for Analysis is used interpret variable relationships accurately for better data-driven insights.
Why Does Correlation Not Imply Causation?
An observed association can arise for several reasons. Understanding these possibilities helps analysts avoid drawing unsupported conclusions.
1. Confounding variables
A confounding variable can influence both the factor being studied and the outcome, creating or distorting an observed association.
For example, ice cream sales and swimming-related accidents may increase during warmer months. Temperature and seasonal activity can influence both, so the relationship between ice cream sales and accidents does not establish that one causes the other.
In business analytics, seasonal demand may influence both advertising expenditure and sales. If an analyst ignores seasonality, the estimated relationship between advertising and sales may be misleading.
2. Reverse causality
Reverse causality occurs when the assumed direction of influence is incorrect or when influence may operate in both directions.
For example, a company may observe that customers who receive more promotional emails also make more purchases. It might conclude that sending more emails increases purchases. However, customers who already purchase frequently may be more likely to subscribe to marketing communications or be targeted by the marketing team.
The observed relationship may reflect existing customer behavior, targeting decisions, or a combination of factors.
3. Coincidence
Two variables may appear related by chance, especially when analysts examine many variables or repeatedly search a dataset for patterns.
For example, a business may discover that sales increased during the same week it changed its internal meeting schedule. Without a credible mechanism or stronger supporting evidence, the timing alone does not demonstrate that the schedule caused the increase.
4. Selection bias
Selection bias occurs when the process used to select participants or observations affects the results.
For example, customers who voluntarily join a loyalty program may differ from other customers in spending habits, brand preference, and engagement. Findings based only on loyalty-program members may not generalize to the wider customer population.
According to a study published on ResearchGate, Bayes’ Theorem supports evidence-based decision-making in fields such as healthcare and finance by updating probability estimates as new information becomes available, helping improve the reliability of predictive analysis. These possibilities demonstrate why analysts must examine how data were collected and consider alternative explanations before interpreting statistical relationships.
Real-World Examples of Correlation vs Causation
1. Marketing and sales analytics for data interpretation
Suppose a marketing analyst observes that customers who receive more promotional emails also make more purchases.
At first glance, this may suggest that sending additional emails increases sales. However, frequent buyers may be more likely to subscribe to promotional communications, and marketing teams may deliberately send more emails to high-value customers.
The observed association may therefore reflect existing customer behavior or targeting decisions.
How to investigate causation: The company can run a randomized email marketing experiment. Eligible customers are randomly assigned to different email frequencies while other campaign conditions remain comparable. The analyst then compares purchase rates or revenue between the groups.
Random assignment helps reduce systematic differences between groups. The company should also monitor unsubscribes, missing outcomes, and potential negative effects on customer experience.
2. Healthcare and lifestyle analysis
Data Analytics in healthcare: Researchers may observe an association between physical activity and better health outcomes.
However, age, existing health conditions, diet, and socioeconomic circumstances may influence both physical activity and health. These factors complicate the interpretation of observational findings.
How to investigate causation: Researchers may use appropriate randomized interventions when ethical and practical, or apply observational causal inference methods with clearly stated assumptions. Longitudinal data, adjustment for relevant confounders, and sensitivity analyses can strengthen an investigation, although they cannot automatically eliminate all sources of bias.
3. Website performance and conversion rates
While doing Data Analysis in e-commerce notices that visitors who spend more time on its website are more likely to make purchases.
The company might conclude that increasing time spent on the website will improve conversion rates. However, visitors who are already interested in a product may naturally spend more time researching it. A confusing checkout process may also increase time spent on the site without improving purchases.
How to investigate causation: The company can test a specific website improvement, such as clearer product information or a simplified checkout process, using a randomized A/B test. It can then compare conversion rates, revenue per visitor, and checkout abandonment between the treatment and control groups.
The important distinction is that the company tests a specific intervention rather than assuming that increasing time on the website will cause more sales.
Refer to the articles below:
- Data Analyst Career Scope in India
- What would be the Data Analyst Course Fee in India
- Mastering Data Analytics in India
How Do Data Analysts Identify Causation?
Data analysts use different methods to investigate cause-and-effect relationships. The most suitable method depends on the research question, available data, ethical considerations, and whether an experiment is feasible.
1. A/B testing
A/B testing compares two versions of a product, website, advertisement, or customer experience.
For example, an e-commerce company can randomly assign eligible visitors to either its existing checkout page or a redesigned version. It then compares purchase conversion rates between the groups.
Random assignment helps make the groups comparable on average, allowing the analyst to estimate the effect of the redesign under the experiment's conditions.
Good practices include defining the primary outcome in advance, calculating an appropriate sample size, and avoiding decisions based solely on early favorable results.
2. Controlled experiments
A controlled experiment evaluates an intervention while keeping other conditions as comparable as possible.
For example, a company evaluating a new employee training program might compare outcomes for employees who receive the training with those for employees in a suitable control group.
Random assignment, consistent measurement, and appropriate handling of missing data help reduce alternative explanations for differences in outcomes.
3. Randomized controlled trials
A randomized controlled trial assigns eligible participants randomly to treatment and control groups.
Randomization makes measured and unmeasured baseline characteristics comparable between groups on average, subject to chance and the study's implementation.
These trials are widely used in research and can also evaluate educational programs, customer interventions, and business policies.
However, randomization does not automatically resolve problems such as poor compliance, substantial participant dropout, measurement errors, or limited generalizability.
4. Causal inference methods for observational data
Randomized experiments are not always practical, affordable, or ethical. In these situations, analysts may use observational causal inference methods.
Common approaches include:
- Matching: Compares treated and untreated observations with similar measured characteristics. Matching does not automatically eliminate confounding from unmeasured factors.
- Difference-in-differences: Compares changes over time between a group exposed to an intervention and a comparison group. The design generally relies on a credible parallel-trends assumption and other conditions.
- Instrumental variables: Uses a variable that influences treatment exposure but satisfies additional assumptions, including a suitable exclusion restriction, for a causal interpretation.
- Regression adjustment: Accounts for measured confounding variables through a statistical model, provided the relevant assumptions are credible.
- Regression discontinuity: Uses a treatment assignment threshold to estimate causal effects near the cutoff when the design's assumptions hold.
No method establishes causation simply because it has been applied. Analysts must explain the assumptions behind their approach, evaluate data quality, and consider whether alternative explanations remain plausible.
Practical Data Analytics Example: Does Advertising Increase Sales?
Data analytics in Retail Example:Consider an online retailer that wants to determine whether a new advertising campaign increases purchases.
The following figures are illustrative, not results from an actual business experiment.
| Metric | Control group | Advertising group |
| Customers | 1,000 | 1,000 |
| Customers who purchased | 100 | 130 |
| Conversion rate | 10% | 13% |
The observed results can be calculated as follows.
Step 1: Calculate the conversion rates.
Control group:
100 ÷ 1,000 × 100 = 10%
Advertising group:
130 ÷ 1,000 × 100 = 13%
Step 2: Calculate the absolute difference.
13% − 10% = 3 percentage points.
The advertising group had a conversion rate three percentage points higher than the control group.
Step 3: Calculate the relative increase.
{(13% - 10%)/ 10%}×100= 30%
The observed conversion rate was 30% higher relative to the control group's conversion rate.
Step 4: Evaluate whether the difference supports a causal conclusion
These descriptive results alone do not prove that advertising caused the improvement. The analyst needs to establish how customers were assigned to the groups, whether the groups were comparable, and whether the experiment was implemented appropriately.
If customers were randomly assigned and the experiment was properly conducted, the comparison can provide evidence of a causal effect for the population and conditions studied.
The analyst should also assess statistical uncertainty, experiment quality, advertising costs, and potential effects on customer behavior before recommending a broader rollout.
This example illustrates how data analysts move from observing a difference to evaluating whether the evidence supports a causal interpretation.
Common Mistakes Data Analysts Should Avoid
When interpreting relationships between variables, analysts should avoid the following errors.
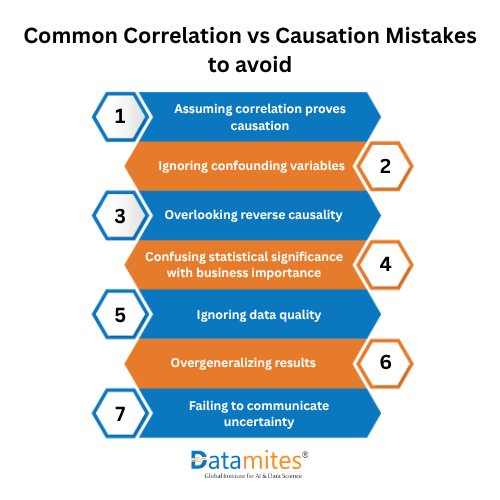
- Assuming correlation proves causation: Even a strong statistical association does not establish cause and effect.
- Ignoring confounding variables: Seasonality, customer demographics, and existing behavior may influence multiple variables.
- Overlooking reverse causality: The apparent outcome may also influence the supposed cause.
- Confusing statistical significance with business importance: A statistically significant effect may be too small to justify implementation costs.
- Ignoring data quality: Missing observations, measurement errors, inconsistent definitions, and selection bias can distort findings.
- Overgeneralizing results: An effect observed in one sample, location, or period may not apply to other populations or conditions.
- Failing to communicate uncertainty: Analysts should explain limitations, assumptions, and plausible alternative interpretations instead of presenting every finding as definitive.
Reliable analysis combines statistical methods with subject-matter knowledge, transparent reporting, and careful consideration of how data were collected.
Best Practices for Reliable Causal Analysis
Before making a causal claim, data analysts should:
- Define the research question and the specific intervention or exposure.
- Identify the outcome and the population of interest.
- Develop a plausible causal explanation using domain knowledge.
- Consider confounding variables, selection bias, and reverse causality.
- Use randomization when appropriate and feasible.
- For observational studies, select a credible causal design and state its assumptions.
- Validate data quality and assess whether conclusions are sensitive to reasonable analytical choices.
- Report effect sizes, uncertainty, limitations, and practical implications.
- Distinguish clearly between observed associations and estimated causal effects.
These practices help businesses make better-informed decisions without overstating what the evidence can establish.
Refer to the articles below:
- What Is Feasibility Analysis and How Is It Used in Data-Driven Decision-Making
- What Is a Snowflake Database and How Does It Work for Data Analytics
- What Is Data Anonymization and Why Is It Important for Data Privacy
Understanding correlation vs causation helps data analysts interpret relationships accurately and make evidence-based decisions. While correlation identifies patterns between variables, causation examines cause-and-effect relationships. Using A/B testing, randomized experiments, and reliable data analysis methods helps analysts evaluate confounding factors and draw more meaningful conclusions.
DataMites Institute offers career-focused training in Data Science, Artificial Intelligence, Machine Learning, and Data Analytics to help learners gain practical, industry-relevant skills. Professionals and aspiring analysts can explore the Data Analyst Course in Bangalore, which emphasizes practical learning and analytical skill development. The institute supports career growth through hands-on projects, internship opportunities, and placement assistance. Its programs include certifications from IABAC and NASSCOM FutureSkills, with flexible online and classroom learning options. In addition to its DataMites Pune presence, DataMites serves learners across major Indian cities, including Hyderabad, Delhi, Chennai, Mumbai, Kolkata, Coimbatore, and Chandigarh.