What Is a Snowflake Database and How Does It Work for Data Analytics?
Discover what a Snowflake database is, how Snowflake architecture works, and its key features and benefits for data analytics. Learn about cloud data warehousing, query processing, scalability, and how Snowflake helps businesses turn data into actionable insights.
 Kriti Maurya
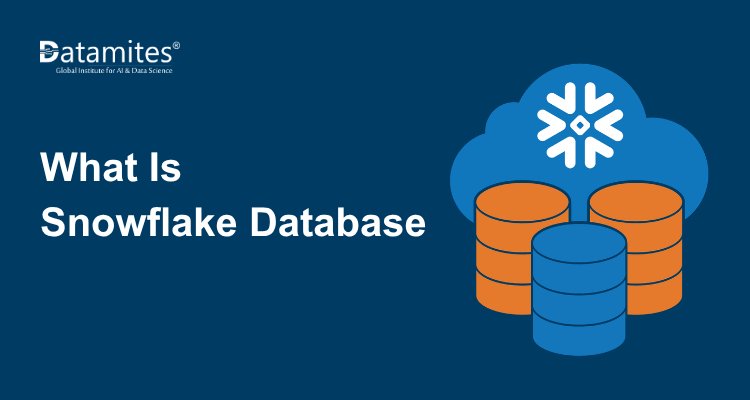
Snowflake is a cloud-based data platform that enables organizations to store, process, integrate, and analyze large volumes of data. Its architecture separates data storage from compute resources, allowing businesses to scale analytical workloads without managing traditional data warehouse infrastructure.
Snowflake supports SQL-based analytics, data engineering, business intelligence, and secure data sharing. It runs on cloud infrastructure provided by Amazon Web Services (AWS), Microsoft Azure, and Google Cloud.
For example, a retail company can combine sales, inventory, and customer data in Snowflake to calculate monthly revenue, identify popular products, analyze purchasing patterns, and improve inventory planning. Data analysts can query this information using SQL, while data engineers can build pipelines that prepare data for reporting and business intelligence.
However, Snowflake's performance and cost depend on several factors, including query design, data volume, warehouse configuration, workload concurrency, and usage patterns.
Here we will discuss what Snowflake is, how its architecture works, how to use SQL for data analytics, its key benefits and limitations, and how it compares with other data platforms.
What Is a Snowflake Database?
Snowflake is a managed cloud data platform designed for data warehousing, data engineering, analytics, and data collaboration.
Although people commonly refer to it as a Snowflake database, the platform offers more than traditional database functionality. It combines managed data storage, query processing, security, metadata management, and other services that support analytical workloads.
Unlike a conventional on-premises data warehouse, Snowflake manages much of the underlying infrastructure. Organizations can create databases and tables, load data, execute SQL queries, and connect business intelligence tools without managing the physical database servers themselves.
Snowflake supports structured data, such as relational sales records, and semi-structured data, such as JSON, Avro, and Parquet data. It also provides capabilities for supported unstructured-data workflows and data applications.
Common uses of Snowflake include:
- Business intelligence: Data Preparation for data analysis and Preparing datasets for dashboards and management reports.
- Data warehousing: Consolidating information from multiple operational systems.
- Data engineering: Loading, cleaning, transforming, and organizing data.
- Business analytics: Evaluating revenue, customer behavior, product performance, and operational trends.
- Data sharing: Providing controlled access to data for authorized internal teams and external partners.
According to Snowflake's official documentation, its architecture is organized into three primary layers: database storage, query processing, and cloud services.
Snowflake Architecture
Snowflake's architecture separates persistent data storage from the compute resources that execute queries. This design allows organizations to scale storage and computing resources independently and use separate compute resources for different workloads.
The three main architectural layers are explained below.
Database Storage
The storage layer holds data in cloud storage managed by Snowflake. Data stored in standard Snowflake tables is automatically organized into an optimized, compressed, columnar format.
Snowflake organizes table data into units called micro-partitions. Each micro-partition contains a portion of a table's data and has associated metadata that can help Snowflake determine which data is relevant to a query.
For example, consider a sales table containing several years of transactions. If an analyst queries sales records for a specific month, Snowflake may be able to skip micro-partitions that cannot contain records for that period.
This process is called micro-partition pruning. It can reduce unnecessary data scanning and improve query efficiency, depending on the table's data organization and filtering conditions.
Unlike traditional data warehouses that may require users to manage physical partitions, Snowflake automatically handles micro-partition organization for standard tables.
Query Processing
The compute layer executes SQL queries and other supported workloads through virtual warehouses.
A virtual warehouse is a compute cluster that provides the resources required to run queries, load data, and perform data transformations. It operates independently of the underlying storage layer.
For example, a business could use one warehouse for scheduled data transformations and another for interactive business intelligence queries. Both warehouses can access the same underlying data without relying on a single shared compute cluster.
Organizations can resize warehouses, configure automatic suspension and resumption, and allocate separate compute resources to different teams.
These capabilities help manage workload requirements, but they do not guarantee that every query will run faster. Performance depends on query complexity, warehouse size, concurrency, and other factors.
Cloud Services
The cloud services layer coordinates operations across the Snowflake platform. Its responsibilities include authentication, access control, metadata management, query parsing, query optimization, and coordination of query execution.
When an analyst submits a SQL statement, Snowflake's services validate and prepare the query. The query optimizer develops an execution plan, and the appropriate compute resources execute it.
This coordination helps Snowflake manage queries, enforce permissions, and organize platform operations.
Refer to the articles below:
- Top 5 Emerging Trends in Data Analytics
- Data Analytics in the Age of Big Data & Machine Learning
- Evolving Data Careers: Data Analysts vs. Data Scientists
How Snowflake Uses Virtual Warehouses
Virtual warehouses are an important part of Snowflake's workload management model.
Consider a retail organization with three types of analytical workloads:
- Data transformation: Cleaning and aggregating daily transaction records.
- Business intelligence: Refreshing dashboards for sales managers.
- Ad hoc analysis: Allowing analysts to investigate sales trends and customer behavior.
The organization can assign these workloads to separate virtual warehouses. Each warehouse uses its own compute resources while accessing shared underlying data.
This arrangement can reduce competition for compute resources between workloads. However, it also requires sensible warehouse configuration and cost monitoring because active warehouses consume compute credits.
Query Optimization in Snowflake
Snowflake uses query optimization, distributed processing, and metadata to execute analytical queries efficiently. One important technique is micro-partition pruning, which reduces the amount of data scanned when Snowflake can determine that certain micro-partitions are irrelevant.
For example, a query that filters transactions to a specific date range may benefit when the relevant date information allows Snowflake to eliminate unrelated micro-partitions.
Analysts and data engineers can investigate query performance using Snowflake's Query Profile, which provides information about execution steps, data scanning, processing, and other query characteristics.
Rather than assuming that a larger warehouse will always solve performance problems, teams should examine the query profile, review SQL logic, and test configuration changes against representative workloads.
How Does Snowflake Work?
Snowflake combines data ingestion, cloud storage, compute resources, and analytical tools in a managed environment. A typical analytics workflow involves five stages.
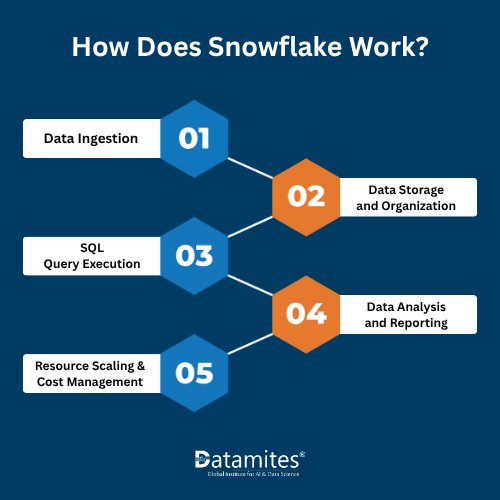
Step 1: Data Ingestion
Organizations collect data from business applications, operational databases, cloud storage, external files, and other sources.
Snowflake supports multiple data ingestion approaches, depending on the source system and latency requirements. These include the COPY INTO command, Snowpipe, Snowpipe Streaming, connectors, and third-party integration tools.
For example, a retailer may load daily transaction files from cloud storage and use an automated ingestion pipeline to make new records available for analysis.
The appropriate ingestion method depends on data format, arrival frequency, processing requirements, and the intended analytical use case.
Step 2: Data Storage and Organization
After ingestion, Snowflake stores data in its managed cloud storage environment and organizes standard table data into compressed columnar structures.
For instance, a retailer may create separate schemas for sales, inventory, and customer data. Analysts can then access curated datasets rather than repeatedly processing raw source files.
Data quality checks, standardization, and transformation are also important at this stage because inaccurate or inconsistent source data can lead to misleading analytical results.
Step 3: SQL Query Execution
When an analyst submits a SQL query, Snowflake validates the statement and develops an execution plan. A virtual warehouse provides the compute resources needed to execute the query.
Snowflake can use metadata to exclude irrelevant micro-partitions and process data in parallel. The effectiveness of these techniques depends on the query, the data organization, and the available compute resources.
Step 4: Data Analysis and Reporting
The query results can be used to calculate business metrics, identify patterns, investigate anomalies, and generate reports.
Business intelligence tools can connect to Snowflake to create interactive dashboards. Data engineers can also prepare curated datasets for analysts, data analytics in finance team members, sales managers, and other business users.
For example, a sales dashboard could display monthly revenue, product performance, regional sales, and year-over-year growth.
Step 5: Resource Scaling and Cost Management
Organizations can adjust warehouse sizes to meet performance requirements and configure automatic suspension and resumption to manage compute consumption.
Storage and compute are managed separately, but the costs associated with them differ. Warehouse activity, storage, serverless features, data transfer, and other applicable services may contribute to the total cost, depending on the configuration and commercial terms.
Teams should monitor usage and evaluate the relationship between query performance and cost rather than scaling resources without measuring the results.
Practical Example: Analyzing Retail Sales Using Snowflake SQL
Consider a retailer that stores transaction records in a table named SALES.
Assume the table contains the following columns:
SALE_DATE: The date of the transaction.
PRODUCT_NAME: The name of the product sold.
QUANTITY: The number of units sold.
REVENUE: The revenue associated with the transaction.
An analyst wants to calculate monthly revenue and units sold for each product during 2026.
The following Snowflake SQL query illustrates how to perform this analysis:
SELECT
DATE_TRUNC('MONTH', SALE_DATE) AS SALES_MONTH,
PRODUCT_NAME,
SUM(QUANTITY) AS UNITS_SOLD,
SUM(REVENUE) AS TOTAL_REVENUE
FROM SALES
WHERE SALE_DATE >= '2026-01-01'
AND SALE_DATE < '2027-01-01'
GROUP BY
DATE_TRUNC('MONTH', SALE_DATE),
PRODUCT_NAME
ORDER BY
SALES_MONTH,
TOTAL_REVENUE DESC;
How the SQL Query Works
SELECT: Specifies the month, product, total units sold, and total revenue to return.
DATE_TRUNC: Groups transactions into monthly periods.
WHERE: Restricts the analysis to transactions from calendar year 2026.
SUM: Calculates the total quantity and revenue for each product and month.
GROUP BY: Aggregates records for each month-product combination.
ORDER BY: Sorts the results by month and then by revenue in descending order within each month.
The query assumes that the SALES table exists, the specified columns are available, and REVENUE uses a consistent currency and represents revenue at the transaction level.
The date filter uses an inclusive start date and an exclusive end date. This approach also handles timestamp values occurring on the final day of the year.
How a Business Can Use the Results
The resulting dataset can help a retailer:
- Identify products generating the highest monthly revenue.
- Compare units sold across different periods.
- Examine seasonal sales patterns.
- Support inventory planning and sales forecasting.
- Build dashboards for management reporting.
These results should be interpreted alongside other business information. For example, a product with high revenue may not necessarily generate the highest profit, and sales figures alone do not explain inventory shortages or customer returns.
Practical learning suggestion: To turn this example into a hands-on demonstration, load a sample sales dataset into a Snowflake table, execute the query, inspect the output, and use Query Profile to review its execution. If you publish screenshots or performance measurements, use results obtained from your actual environment and identify the relevant data volume and warehouse configuration.
Benefits of Snowflake for Data Analytics
Snowflake provides several capabilities for analytical workloads. Its practical value depends on the organization's architecture, data requirements, governance policies, and budget.
- Scalability: Snowflake allows organizations to manage storage and compute resources independently. Businesses can increase storage as datasets grow without necessarily resizing their virtual warehouses. They can also adjust compute capacity to handle demanding queries or periods of increased activity.
- Query Performance: Snowflake uses distributed query processing, columnar storage, micro-partition metadata, and query optimization to support analytical workloads. However, performance depends on the workload. Complex joins, inefficient SQL, large scans, high concurrency, and unsuitable warehouse configurations can affect response times.
- Data Integration: Snowflake supports structured and semi-structured data, including formats such as JSON, Avro, and Parquet. Its ingestion and transformation capabilities allow organizations to combine data from different systems into centralized analytical datasets.
- Reduced Infrastructure Management: Snowflake manages much of the underlying infrastructure and platform maintenance. This can reduce the operational burden associated with provisioning and maintaining a traditional on-premises data warehouse.
- Secure Data Sharing: Snowflake supports controlled data sharing with authorized consumers, including other Snowflake accounts. Organizations can share supported datasets with internal teams and external partners without always having to create and transfer separate copies of the shared data.
- Flexible Workload Management: Separate virtual warehouses can support data transformations, business intelligence, and ad hoc analysis. This separation can help teams manage compute resources independently and reduce competition between workloads. Warehouse sizes and configurations should be selected using actual workload measurements rather than assuming that larger warehouses always offer better value.
- Governance responsibilities: Managed infrastructure does not eliminate the need for access controls, data quality checks, compliance processes, and retention policies.
- Platform integration: Existing cloud commitments, tools, data pipelines, and team skills can affect the effort required to adopt Snowflake.
- Cost Management: Snowflake uses consumption-based pricing for applicable services, with costs determined by usage and account terms. Organizations can improve cost visibility by:
- Monitoring compute-credit consumption.
- Configuring automatic warehouse suspension and resumption.
- Reviewing expensive or frequently executed queries.
- Using resource monitors where applicable.
- Establishing budgets, alerts, and regular usage reviews.
Cost optimization should consider both spending and performance. A smaller warehouse may cost less per unit of time but take longer to finish a workload, so representative testing is important.
Evaluating these considerations helps organizations determine whether Snowflake aligns with their technical requirements and business objectives.
Refer to the articles below:
- What would be the Data Analyst Course Fee in India
- How to Become A Data Analyst – Best Certification Courses in India
- Data Analyst Career Scope in India
Hands-On Snowflake Tutorial: Analyze Sales Data Using SQL
A practical way to understand Snowflake is to create a small sales dataset, execute an analytical query, and inspect the query execution details.
Step 1: Create a Sample Sales Table
The following SQL creates a table for a simple retail data analytics exercise.
CREATE OR REPLACE TABLE SALES_EEAT_DEMO (
SALE_DATE DATE,
PRODUCT_NAME VARCHAR(100),
QUANTITY NUMBER(10, 0),
REVENUE NUMBER(12, 2)
);
Step 2: Insert Sample Records
INSERT INTO SALES_EEAT_DEMO
(SALE_DATE, PRODUCT_NAME, QUANTITY, REVENUE)
VALUES
('2026-01-05', 'Laptop', 2, 2400.00),
('2026-01-12', 'Keyboard', 5, 250.00),
('2026-02-03', 'Laptop', 1, 1200.00),
('2026-02-18', 'Monitor', 3, 900.00),
('2026-03-09', 'Keyboard', 4, 200.00);
These are fictional demonstration records, not actual business data.
Step 3: Calculate Monthly Revenue
SELECT
DATE_TRUNC('MONTH', SALE_DATE) AS SALES_MONTH,
PRODUCT_NAME,
SUM(QUANTITY) AS UNITS_SOLD,
SUM(REVENUE) AS TOTAL_REVENUE
FROM SALES_EEAT_DEMO
GROUP BY
DATE_TRUNC('MONTH', SALE_DATE),
PRODUCT_NAME
ORDER BY
SALES_MONTH,
TOTAL_REVENUE DESC;
The query groups the records by month and product, then calculates units sold and total revenue.
Step 4: Verify the Results
For the sample records above, the expected aggregated results are:
Month Product Units sold Total revenue
January 2026 Laptop 2 2,400.00
January 2026 Keyboard 5 250.00
February 2026 Monitor 3 900.00
February 2026 Laptop 1 1,200.00
March 2026 Keyboard 4 200.00
These expected results can be calculated directly from the inserted sample records. They are not represented as output captured from a live Snowflake environment.
Step 5: Investigate Query Performance
In a Snowflake worksheet, execute the query and open its Query Profile from the query results or query history interface.
Review the available execution details, including table scans, processing steps, and data volume where shown.
For this small demonstration dataset, do not expect meaningful performance conclusions. A useful performance experiment requires a larger representative dataset, documented warehouse settings, repeatable queries, and measurements collected under controlled conditions.
Difference Between Snowflake and Other Data Platforms
Snowflake differs from other data platforms in its architecture, management approach, compute options, and workload capabilities.
The most suitable platform depends on data volume, analytical requirements, governance, existing infrastructure, team skills, and total cost of ownership.
Snowflake vs Traditional On-Premises Data Warehouses
| Feature | Snowflake | Traditional on-premises warehouse |
| Infrastructure | Managed cloud service | Organization manages infrastructure |
| Scalability | Storage and compute can be managed independently | Depends on hardware and system architecture |
| Maintenance | Much of the platform maintenance is managed | Often requires internal infrastructure administration |
| Cost structure | Usage-based cloud charges | Hardware, licensing, staffing, and maintenance costs may apply |
| Deployment | Runs on supported cloud infrastructure | Can run in an organization's own data center |
Snowflake can reduce infrastructure administration and offer flexible resource management. However, organizations with strict infrastructure-control requirements, existing hardware investments, or specialized workloads may have reasons to use other platforms.
Snowflake vs Other Cloud Data Platforms
| Feature | Snowflake | Google BigQuery | Amazon Redshift | Databricks |
| General focus | Cloud data platform and analytics | Cloud analytics and data warehousing | Cloud data warehousing | Lakehouse, data engineering, analytics, and AI |
| Compute model | Virtual warehouses and other managed compute options | Serverless and capacity-based options | Provisioned and serverless options | Options including SQL warehouses and processing compute |
| Typical strength | Managed analytics and data collaboration | Analytics integrated with Google Cloud | Analytics integrated with AWS | Data engineering, lakehouse workloads, and machine learning |
| Key evaluation factors | Warehouse configuration, ecosystem, cost, and governance | Pricing model, data layout, and ecosystem | Compute configuration, data design, and AWS integration | Workload needs, architecture, integrations, and cost |
This comparison summarizes general platform positioning rather than every available feature. All four platforms continue to evolve, and each supports multiple workloads and configuration options.
Organizations should evaluate platforms using representative workloads instead of relying only on feature lists. Useful evaluation criteria include:
- Query latency and concurrency.
- Data ingestion and transformation requirements.
- Integration with existing tools.
- Security and governance requirements.
- Operational effort and available technical data analyst skills.
- Total cost under realistic workload conditions.
Snowflake is a managed cloud data platform that combines cloud storage, scalable compute resources, and cloud services to support data warehousing and analytics. The Mordor Intelligence reports, the global database market was valued at USD 150.38 billion in 2025 and is projected to grow from USD 171.36 billion in 2026 to USD 329.05 billion by 2031, registering a compound annual growth rate (CAGR) of 13.95% during the forecast period.
Refer to the articles below:
- What Is Data Anonymization and Why Is It Important for Data Privacy
- What Is Categorical Analysis and How Do Data Analysts Use It
- Why Storytelling in Data Analytics Has Become a Critical Skill
Snowflake enables independent storage and compute scaling, efficient SQL analytics, data integration, and secure data sharing. Professionals should understand its architecture, optimize queries, manage access controls, and monitor costs. Learning SQL, data modeling, data warehousing, and cloud analytics builds a strong foundation.
DataMites Institute is a professional training institute offering career-focused programs in Data Science, Artificial Intelligence, Machine Learning, and Data Analytics. Learners can also explore the Data Analyst Course in Mumbai to develop analytical skills and gain practical knowledge. The institute emphasizes hands-on learning through practical projects, internships, and placement assistance to help learners build industry-relevant skills. With certifications associated with IABAC and NASSCOM FutureSkills, DataMites offers flexible online and classroom learning options to suit different learning needs.
In addition to DataMites Delhi, has a presence in major Indian cities, including Bangalore, Pune, Chennai, Mumbai, Kolkata, Coimbatore, and Chandigarh, providing learners with access to its training programs across multiple locations.