What Is Graph Data Science? A Complete Beginner's Guide
Graph Data Science explained in simple terms, covering key concepts, applications, algorithms, and how beginners can start learning graph-based data analysis.
 Prerana B A
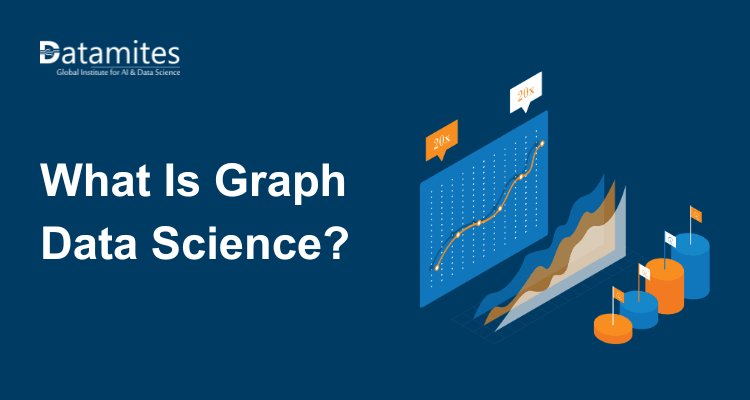
Modern organizations collect data from customers, products, transactions, websites, applications, and connected devices. Much of this data is connected through relationships between people, products, accounts, and systems. Graph Data Science helps analyze these connections by representing entities as nodes and relationships as edges, making it easier to identify patterns, similarities, and communities.
For graph data science for beginners, understanding how graph-based analysis works, its key concepts, applications, and differences from traditional data science provides a useful foundation. These areas help learners understand how connected data can be analyzed to solve practical problems.
The growing adoption of graph-based technologies is also reflected in the graph database market. According to MarketsandMarkets, the global graph database market is projected to grow from USD 0.51 billion in 2024 to USD 2.14 billion by 2030, registering a 27.1% CAGR during the period. This growth highlights the increasing use of graph databases for managing and analyzing interconnected data.
What Is Graph Data Science?
Graph Data Science is an approach to analyzing connected data by representing entities as nodes and relationships as edges. It helps identify patterns, connections, similarities, and communities within complex datasets.
Unlike traditional data analysis, Graph Data Science focuses not only on individual records but also on how entities are connected. It uses graph algorithms and machine learning techniques for applications such as fraud detection, recommendation systems, cybersecurity, and social network analysis.
Refer to these articles :
- How LLMs Are Transforming Data Science Careers in 2026
- Role of Data Science in Smart Cities and Internet of Things (IoT)
- Data Science vs Cyber Security: Which Has Better Future?
How Does Graph Data Science Work?
Graph Data Science combines graph structures with analytical and machine learning methods to understand connected data.
A simple graph can be represented as:
Customer → purchased → Product
Here, the customer and product are nodes, while "purchased" is the relationship between them.
A larger dataset could contain thousands or millions of these connections. By analyzing them together, data scientists can identify patterns in how entities interact.
A typical Graph Data Science workflow includes the following steps:
1. Collect and Prepare Data
Data is first collected from relevant sources and cleaned. Duplicate records, missing values, inconsistent identifiers, and incorrect relationships may need to be addressed.
2. Build the Graph
Relevant entities are represented as nodes, and relationships are represented as edges.
For example:
Customer A → purchased → Laptop
Customer A → purchased → Mouse
Customer B → purchased → Laptop
Customer B → purchased → Keyboard
This structure allows analysts to examine both the entities and their relationships.
3. Apply Graph Analysis
Different data science techniques can then be applied to the graph. These may include centrality analysis, community detection, similarity analysis, pathfinding, and link prediction.
Each technique answers different questions. For example, centrality can help identify highly connected nodes, while community detection can reveal groups of closely connected entities.
4. Use Machine Learning
Graph information can also be used in machine learning. Graph embeddings convert graph structures into numerical representations, while graph neural networks can learn from both node information and graph connectivity.
5. Interpret the Results
The final step is connecting the analytical results to a practical question.
For example, a retailer might use customer-product relationships to understand purchasing patterns, while a financial organization might investigate connections between accounts and transactions.
The graph itself is not the final goal. The purpose is to extract useful information from relationships within the data.
Key Concepts in Graph Data Science
Understanding the basic terminology makes Graph Data Science easier to learn.
Nodes and Edges
Nodes represent entities, while edges represent relationships.
For example:
Person → follows → Person
Each person is a node, and the "follows" relationship is an edge.
Depending on the dataset, edges can also contain information such as dates, transaction values, or relationship types.
Graph Algorithms
Graph algorithms analyze the structure of connected data. Common categories include centrality, community detection, similarity, pathfinding, and link prediction.
For example, centrality algorithms can help identify important nodes within a network, while community detection algorithms can identify groups of connected nodes.
Community Detection
Community detection identifies groups of nodes that are strongly connected or share structural characteristics.
In a social network, this could help identify clusters of users who interact frequently.
Link Prediction
Link prediction examines existing relationships and graph structure to estimate potential connections.
For example, an online platform could analyze relationships between users and products to identify products that may be relevant to a particular customer.
Graph Embeddings
Graph embeddings represent graph entities as numerical vectors. These representations can then be used in machine learning tasks such as similarity analysis, classification, or link prediction.
Graph Machine Learning
Graph machine learning combines graph structure with machine learning. Graph neural networks are one important approach that allows models to work with node features and relationships.
These concepts form an important foundation for graph data science for beginners before moving into advanced graph machine learning.
The growing interest in graph-based approaches is also reflected in the broader graph technology market. According to Grand View Research, the global graph technology market is expected to reach USD 15.80 billion by 2030, growing at a 22.0% CAGR from 2023 to 2030. The growth of this market reflects the increasing use of graph technologies for analyzing relationships and connections across different types of data.
Refer to these articles :
- Which are the best Data Science courses in India?
- What Is The Trend Of Data Science Jobs In India?
- What would be the Data Science Course Fee in India?
Graph Data Science Applications
The relationships between entities can be valuable across many industries. This is why graph data science applications cover a wide range of analytical problems.
Fraud Detection
Fraud can involve relationships between accounts, transactions, devices, merchants, and locations.
Representing these entities as a graph can help investigators examine connections between transactions and identify unusual patterns within a network.
Recommendation Systems
Recommendation systems can connect users with products, movies, articles, or other items they interact with.
For example:
Customer → purchased → Product
If several customers have similar purchasing relationships, graph analysis can help identify potentially relevant products.
Social Network Analysis
Social platforms naturally contain connected data. Users can be represented as nodes, while follows, friendships, messages, or other interactions can be represented as edges.
Graph analysis can then be used to study communities, relationships, and network structures.
Supply Chain Analysis
Supply chains contain many connected entities, including suppliers, manufacturers, warehouses, products, and transportation routes.
A graph representation can help organizations understand dependencies and relationships across the supply network.
Cybersecurity
Cybersecurity systems contain relationships between users, devices, applications, networks, and access permissions.
Graph-based analysis can help security teams investigate how different entities are connected and examine unusual network structures.
Healthcare and Biomedical Research
Biomedical datasets often contain relationships between diseases, genes, proteins, drugs, and biological processes.
Graph-based machine learning is an active research area for problems such as molecular analysis, drug-related prediction tasks, and biomedical knowledge discovery.
Knowledge graphs connect information from different sources and help identify relationships. According to The Business Research Company, the global knowledge graph market is expected to grow from USD 1.61 billion in 2025 to USD 4.46 billion by 2030, at a 22.5% CAGR, driven by applications in analytics, search, recommendations, and AI.
These examples show why graph data science applications are relevant when relationships are an important part of the problem.
Graph Data Science vs Traditional Data Science
Graph Data Science vs traditional data science is not necessarily a choice between two separate approaches. Graph methods can be used alongside conventional data science techniques.
Traditional data science often works with tables containing rows and columns. For example, a customer dataset might contain age, location, purchase amount, and customer status.
Graph Data Science adds another dimension by explicitly representing relationships.
Consider a customer dataset:
| Traditional Data | Graph Representation |
| Customer ID | Customer node |
| Product ID | Product node |
| Purchase record | Customer → purchased → Product |
| Customer attributes | Node properties |
Traditional data analysis may ask, “How much did a customer spend?” Graph analysis can look deeper by asking, “Which customers bought similar products, and how are they connected?” Both approaches are useful, depending on the type of data and the question you want to answer.
Graph methods are particularly relevant when relationships, networks, or connections contain important information that may not be captured adequately by treating records independently.
Refer these articles :
- Secure Data Science Pipelines: Preventing Data Leakage and Attacks
- Top 10 Best IDEs for Data Science in 2026
- Top Anomaly Detection Techniques in Data Science for 2026
How Can Beginners Start Learning Graph Data Science?
For someone searching for graph data science for beginners, starting with fundamentals is more practical than immediately studying advanced graph neural networks.
A simple learning path is:
- Learn Python: Build a foundation in programming and data manipulation.
- Understand basic data science: Study statistics, data cleaning, visualization, and machine learning fundamentals.
- Learn graph concepts: Understand nodes, edges, paths, degree, connectivity, and communities.
- Practice graph algorithms: Start with centrality, similarity, community detection, and pathfinding.
- Explore graph databases: Learn how connected information can be stored and queried.
- Study graph machine learning: Move into embeddings, node classification, link prediction, and graph neural networks.
- Build projects: Create a recommendation network, social network analysis project, or customer-product graph.
Starting with small datasets makes the concepts easier to understand. Once the fundamentals are clear, learners can gradually work with larger and more complex graphs.
Graph Data Science helps us understand the relationships between different types of data. By using nodes, edges, graph algorithms, and machine learning, it can identify useful patterns in areas such as fraud detection, recommendations, cybersecurity, and supply chains. Beginners can start by learning Python and data science basics, followed by graph concepts, algorithms, and graph databases.
For learners looking to build practical skills in data science and explore areas such as Graph Data Science, DataMites Institute provides industry-oriented Data Science training programs designed to help learners develop practical analytical and technical skills relevant to today’s data-driven industries. Its programs combine structured learning with IABAC® & NASSCOM® Certification, hands-on projects, internship opportunities, and job assistance to support learners in developing career-ready capabilities. The institute has also been awarded as the Best Skill Development EdTech, reflecting its focus on practical, skill-based, and career-oriented learning.
DataMites offers both online and classroom learning options, providing learners with flexible ways to develop their data science skills. With 50+ offline centers across India, DataMites offers Data Science Courses in Delhi and several other major cities, including Hyderabad, Chennai, Pune, Mumbai, Kolkata, Coimbatore, Ahmedabad, and Chandigarh. These learning options allow students, freshers, and working professionals to access structured training, practical learning opportunities, and industry-focused data science education based on their learning preferences and career goals.