What Is the CRISP-DM Process and Is It Still Useful for Data Analysts
Learn what the CRISP-DM process is, explore its six phases, discover its benefits and limitations, and see how data analysts can apply it in 2026.
 Kriti Maurya
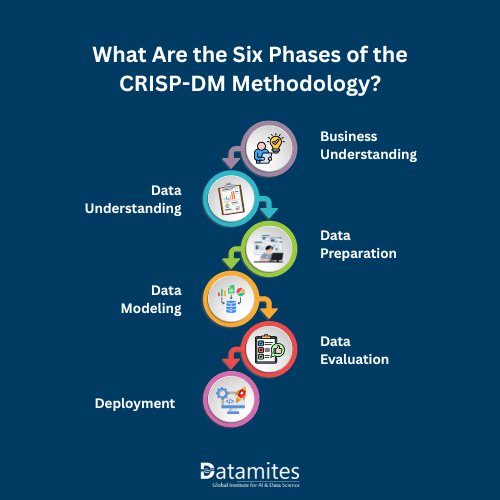
The CRISP-DM process, or Cross-Industry Standard Process for Data Mining, is a structured methodology that helps data professionals transform business problems into meaningful insights and actionable decisions. It consists of six phases: Business Understanding, Data Understanding, Data Preparation, Modeling, Evaluation, and Deployment.
Step-by-step Data Mining Guide, the methodology was developed to provide a consistent approach to data mining projects across industries. It helps teams define objectives, assess data quality, select appropriate analytical techniques, evaluate results, and deliver solutions that support business decisions.
Unlike an individual analytical technique or software tool, CRISP-DM provides an end-to-end framework for managing an analytical project. It encourages analysts to understand the business problem before selecting methods and to assess whether the final results address the original objectives.
A defining characteristic of CRISP-DM is its iterative structure. The six phases are interconnected rather than strictly linear. For example, evaluation may reveal data quality problems that require the analyst to revisit Data Preparation or reconsider the modeling approach.
What Are the Six Phases of the CRISP-DM Methodology?
The six phases of CRISP-DM cover the data mining lifecycle, from understanding a business problem to implementing an analytical solution. Each phase has a distinct purpose, but teams can revisit earlier phases as requirements or findings change.
1. Business Understanding
Business Understanding establishes why the project matters and what it should achieve. Before analyzing data, the analyst works with stakeholders to define the problem, identify objectives, establish success criteria, and understand constraints.
Key activities include:
- Defining the business problem and project objectives.
- Identifying the decisions the analysis should support.
- Establishing measurable success criteria.
- Assessing available resources, constraints, and risks.
- Developing an initial project plan.
Example: A retail company notices declining sales in several regions. Instead of immediately building a forecasting model, the analyst first determines whether the company needs to identify the causes of the decline, forecast future demand, improve product availability, or understand changing customer behavior.
The output is a clearly defined business problem and an agreed-upon approach for evaluating success.
2. Data Understanding
Data Understanding involves collecting initial data, examining its structure, exploring patterns, and determining whether the available information is suitable for the business problem.
Key activities include:
- Collecting data from relevant sources.
- Examining data types, distributions, and relationships.
- Identifying missing values, duplicates, and inconsistencies.
- Exploring trends, patterns, and unusual observations.
- Assessing whether the available data adequately represents the problem.
Example: The Data Analytics in Retail examines transaction records, product information, inventory data, promotional calendars, and historical sales. The initial analysis reveals incomplete sales records for some stores and differences in sales patterns during promotional periods.
These findings help the analyst identify data limitations before investing time in more complex analysis.
Refer to the article below:
- Correlation vs Causation: What Data Analysts Need to Know
- What Is Feasibility Analysis and How Is It Used in Data-Driven Decision-Making
- What Is Data Anonymization and Why Is It Important for Data Privacy
3. Data Preparation
Data Preparation for analysis transforms collected information into a suitable dataset for analysis or modeling. It often requires substantial effort because business data may come from multiple systems with different formats, definitions, and quality standards.
Key activities include:
- Removing duplicate records and correcting inconsistencies.
- Investigating missing values and selecting appropriate treatment methods.
- Standardizing formats, categories, and units.
- Integrating data from multiple sources.
- Creating relevant analytical features.
- Documenting transformations, assumptions, and limitations.
Example: The retail analyst standardizes product identifiers across transaction and inventory systems, investigates missing sales records, aligns transaction dates with promotional calendars, and creates features such as monthly sales analytics, average selling price, and product availability.
Data preparation decisions should be documented carefully. Removing unusual observations or filling missing values without investigating their causes can distort the results.
4. Data Modeling
Modeling involves selecting and applying appropriate analytical techniques to identify patterns, explain relationships, classify observations, or predict future outcomes using data modelling tool.
The method depends on the business objective and the characteristics of the data. Not every project requires machine learning; descriptive statistics, segmentation, hypothesis testing, and regression may be sufficient.
Key activities include:
- Selecting appropriate analytical techniques.
- Defining training, validation, and test datasets when predictive modeling is required.
- Building and comparing models against a baseline.
- Tuning model parameters where appropriate.
- Documenting assumptions and experimental results.
Example: If the retailer wants to forecast product demand, the analyst compares a simple historical-average baseline with suitable forecasting methods. If the objective is to investigate declining sales, the analyst may instead examine regional trends, promotional effects, product performance, and customer purchasing patterns.
The most appropriate method is the one that addresses the business problem effectively, not necessarily the most technically complex one.
5. Data Evaluation
Evaluation determines whether the analytical findings or model performance meet the project's technical requirements and business objectives.
A technically strong model may still be unsuitable if it does not improve decision-making, relies on unreliable data, or performs poorly under realistic conditions.
Key activities include:
- Evaluating results against predefined success criteria.
- Checking predictive performance on data not used for training.
- Reviewing assumptions, limitations, and potential sources of bias.
- Comparing results with an appropriate baseline.
- Confirming that stakeholders can use the findings.
- Determining whether the solution is ready for deployment.
Example: The retail analyst evaluates a demand forecasting model using historical periods excluded from model training. The analyst measures forecast errors and assesses whether the predictions are useful for inventory planning.
Two commonly used metrics are:
- Mean Absolute Error (MAE): Measures the average absolute difference between actual and predicted values.
- Root Mean Squared Error (RMSE): Measures the square root of the average squared prediction errors, giving greater weight to larger errors.
For time-dependent data, evaluation should preserve chronological order where appropriate to prevent future information from leaking into model training.
Technical metrics should also be interpreted alongside business considerations, such as the cost of excess inventory, the impact of stockouts, and the practical value of improved forecasts.
6. Deployment
Deployment turns analytical results into something that people or systems can use. Depending on the project, this may involve publishing a report, building a dashboard, implementing a recommendation, or deploying a predictive model.
Key activities include:
- Presenting findings and recommendations to stakeholders.
- Integrating results into business workflows.
- Documenting the solution and its limitations.
- Establishing monitoring and maintenance procedures where necessary.
- Defining how the solution's effectiveness will be assessed.
Example: The retail analyst publishes a dashboard showing historical sales trends and forecast demand. Inventory managers use the information to support replenishment decisions, while the company tracks whether the decisions improve product availability and inventory efficiency.
For production machine learning systems, deployment may also require automated testing, performance monitoring, data drift detection, and model retraining. These operational practices extend beyond the basic CRISP-DM framework and can be supported by Machine Learning Operations (MLOps).
Must Read article: Introduction to ETL in Data Analytics
Is CRISP-DM Still Useful for Data Analysts in 2026?
Yes. CRISP-DM remains a useful general framework for organizing data analytics, data mining, and data science projects in 2026. Its main strength is its emphasis on connecting business objectives, Data Quality in Digital Transformation, analytical methods, and implementation.
The framework is particularly useful when analysts need to communicate their approach to stakeholders, coordinate work across teams, or ensure that analytical projects produce meaningful business outcomes.
However, CRISP-DM should not be treated as a complete operational guide for every modern analytics environment. Projects involving real-time data, automated pipelines, continuously updated machine learning models, or complex governance requirements may need additional processes and tools.
Key Benefits of CRISP-DM in 2026:
1. Clear project structure
CRISP-DM divides analytical work into manageable phases, helping teams plan activities, communicate progress, and identify next steps.
2. Better data quality
The framework encourages analysts to investigate and validate data before modeling. Identifying missing values, inconsistent records, and data limitations early can reduce avoidable errors.
3. Stronger business alignment
Starting with Business Understanding helps analysts select methods according to the business problem rather than choosing tools simply because they are available.
4. Improved collaboration
The shared framework helps business stakeholders, data analysts, data scientists, and technical teams communicate about objectives, assumptions, findings, and next steps.
5. Flexible and iterative analysis
Teams can revisit earlier phases when new findings emerge. For example, poor model performance may indicate that the dataset needs improvement or that the original business question should be reconsidered.
Limitations of CRISP-DM in Modern Analytics
Although the framework remains useful, its original specification does not provide comprehensive implementation guidance for every contemporary data engineering and machine learning operations requirement.
Its limitations include:
- Limited operational detail: Additional practices may be needed for automated deployment, continuous integration, and production monitoring.
- Complex data environments: Cloud platforms, streaming data, and distributed processing often require specialized architectures and workflows.
- Ongoing model maintenance: Production models may experience data drift or performance degradation, requiring monitoring and retraining.
- Governance and compliance: Projects involving sensitive information or regulated decisions may need additional privacy, security, documentation, and accountability controls.
The practical approach is to use CRISP-DM as the overarching project framework and complement it with the technical, operational, and governance practices required by the project.
Refer to the article below:
- What would be the Data Analyst Course Fee in India
- Data Analyst Career Scope in India
- Why DataMites for Data Analytics Course in India
Practical Example: Applying CRISP-DM to Retail Sales Analytics
Consider a hypothetical retail business experiencing declining sales across several stores. The company wants to investigate the decline and improve its inventory planning.
The following example illustrates how each CRISP-DM phase contributes to the project. It is an illustrative scenario, not a report of measured results from an actual business.
| CRISP-DM phase | Practical application | Expected output |
| Business Understanding | Define the sales problem, affected regions, objectives, and success criteria | Agreed project scope |
| Data Understanding | Explore transactions, product data, inventory, promotions, and seasonal trends | Data quality and exploration report |
| Data Preparation | Resolve inconsistencies, integrate relevant sources, and create analytical features. | Analysis-ready dataset |
| Data Modeling | Analyze sales patterns or compare demand forecasting methods. | Findings or candidate forecasting model |
| Data Evaluation | Check data validity, forecast errors, baseline performance, and business relevance. | Validated findings or selected model |
| Deployment | Publish a dashboard or incorporate forecasts into inventory planning. | Usable reporting or forecasting solution |
How Should the Results Be Measured?
Evaluation criteria should reflect the original business objective.
For a demand forecasting project, useful measures may include:
- MAE: Quantifies the average absolute forecast error.
- RMSE: Gives greater weight to larger prediction errors.
- Stockout rate: Helps assess how frequently products are unavailable.
- Inventory holding costs: Helps evaluate the cost of storing products.
- Product availability: Indicates whether customers can obtain the products they need.
For an investigation into declining sales, the focus may instead be on identifying contributing factors and validating findings with business stakeholders.
For example, an analyst might compare a forecasting model with a simple baseline using historical periods excluded from training. The analyst would then assess whether the improvement is consistent and useful for inventory decisions. The appropriate evaluation method depends on the business objective, data characteristics, and cost of different types of errors.
No numerical improvement should be claimed without actual project data and an appropriate evaluation.
CRISP-DM vs. Modern Data Analytics Workflows
CRISP-DM and modern analytics workflows serve related but different purposes. CRISP-DM provides a high-level structure for analytical projects, while modern workflows add specialized practices for managing data, code, models, and production systems.
| Area | CRISP-DM | Modern analytics workflows |
| Primary purpose | Organize the end-to-end analytical project | Execute, automate, and maintain analytical systems |
| Business objectives | Explicitly addressed through Business Understanding | Addressed through project planning and product requirements |
| Data preparation | Defined as a core phase | May use versioned, automated, or orchestrated pipelines |
| Data Modeling | Supports selecting and evaluating analytical methods | May include experiment tracking and model registries |
| Deployment | Covers delivery of results and solutions | May include automated releases, APIs, and production infrastructure |
| Monitoring | Can be included in deployment planning | May use dedicated monitoring, alerting, and retraining processes |
The approaches are complementary rather than mutually exclusive. An analyst can use CRISP-DM to structure a project and apply specialized tools and processes to implement individual phases.
For example, a reporting project may require data validation and dashboard publishing but no Predictive and Prescriptive Analytics. A machine learning project that serves predictions continuously may require additional MLOps practices for automated testing, controlled deployment, performance monitoring, and retraining.
How Can Data Analysts Apply CRISP-DM Effectively?
Data analysts can apply CRISP-DM more effectively by adapting it to the scale and complexity of their projects instead of treating it as a rigid checklist.
- Define measurable objectives: Agree on what success means before beginning the analysis.
- Validate data early: Check completeness, consistency, relevance, and potential bias.
- Choose methods based on the problem: Use descriptive analysis when sufficient and predictive modeling when it adds value.
- Document decisions: Record data transformations, assumptions, evaluation criteria, and limitations.
- Involve stakeholders throughout: Confirm that findings remain relevant to the original business problem.
- Plan for implementation: Identify who will use the results, how they will access them, and how success will be measured.
- Add monitoring when needed: For production models and automated workflows, define responsibilities for detecting performance changes and updating the solution.
These practices make CRISP-DM more useful as a project framework while allowing teams to incorporate modern analytical tools and operational requirements.
The CRISP-DM process remains a practical foundation for organizing data mining and analytics projects in 2026. Its six phases help analysts define business objectives, understand data limitations, prepare reliable datasets, select suitable Statistical Methods in Data Analytics, evaluate findings, and deliver useful outcomes.
Refer to the article below:
- What Is Categorical Analysis and How Do Data Analysts Use It
- Why Storytelling in Data Analytics Has Become a Critical Skill
- Best Programming Languages for Data Analysts
Its greatest value lies in connecting business needs with analytical decisions rather than prescribing a particular tool or algorithm. For modern projects, teams can complement CRISP-DM with automated data pipelines, version control, governance, and MLOps practices where appropriate.
For aspiring and experienced data analysts, understanding CRISP-DM can help develop a structured approach to solving business problems with data. Readers interested in building these skills can explore relevant DataMites data analytics and data science learning resources, including practical projects that demonstrate how data preparation, analytical techniques, and business decision-making fit together.
DataMites Chennai offers industry-focused training programs in Data Science, Artificial Intelligence, Machine Learning, and Business Analytics. Its curriculum combines practical learning with real-world projects, internship opportunities, and placement assistance to help learners build job-relevant expertise. With certifications associated with IABAC and NASSCOM FutureSkills, the institute provides flexible learning options through online and classroom training. Learners can also explore specialized programs, such as the Data Analyst courses in Ahmedabad. DataMites has a presence across major Indian cities, including Bangalore, Pune, Chennai, Hyderabad, Mumbai, Kolkata, Coimbatore, and Chandigarh, offering learners access to its professional training programs across multiple locations.