What Is Categorical Analysis and How Do Data Analysts Use It?
Learn what categorical analysis is, its types, and how data analysts use categorical data to identify patterns, segment customers, and support business decisions. Explore real-world examples, common techniques, and applications in data analytics.
 Kriti Maurya
Businesses collect large amounts of information about customers, transactions, products, and operational activities. Understanding this information helps organizations identify patterns and make informed decisions. Categorical analysis is a data analysis technique used to organize, summarize, and interpret information grouped into categories.
For example, a business can classify customer feedback as positive, neutral, or negative to understand satisfaction levels. It can also compare purchase conversions across marketing channels to investigate which channels perform differently.
From analyzing customer satisfaction to evaluating product preferences, categorical data analysis supports decision-making across industries. With tools such as Excel, SQL, Python, and Power BI, analysts can examine categorical variables and communicate meaningful insights through statistical summaries and visualizations.
What Is Categorical Analysis?
Categorical analysis is the process of examining data that represents groups, labels, or classifications rather than measured numerical quantities. It helps analysts understand how observations are distributed across different categories and whether relationships exist between categorical variables.
For example, an online retailer might classify customer feedback as positive, neutral, or negative. Analyzing the number and percentage of responses in each category can reveal overall satisfaction patterns and highlight areas requiring improvement.
Unlike numerical data analysis, which focuses on measurements such as revenue, age, or sales volume, categorical analysis focuses on group membership, frequency, proportions, and associations between categories.
What Are the Types of Categorical Data?
Understanding the types of categorical data helps analysts select appropriate statistical methods and visualizations.
1. Nominal Data
Nominal data consists of categories without any inherent order. The categories are distinct labels rather than ranked values.
Examples include:
- Product categories such as electronics, clothing, and furniture.
- Payment methods such as cash, credit card, and digital wallet.
- Countries, departments, and customer acquisition channels.
- Analysts can use frequency distributions and bar charts to identify the most common nominal categories.
2. Ordinal Data
Ordinal data consists of categories with a meaningful order, although the differences between categories are not necessarily equal.
Examples include customer satisfaction levels such as dissatisfied, neutral, and satisfied, or service ratings such as poor, average, good, and excellent.
Analysts can compare category frequencies and examine how responses are distributed across ordered levels. The ordering must be preserved when preparing and interpreting the data.
Refer to the articles below:
- All About Big Data Analytics
- Top Industries Hiring Data Analysts
- Top 5 Emerging Trends in Data Analytics
3. Binary Categorical Data
Binary categorical data contains two possible categories, such as yes or no, approved or rejected, and converted or not converted.
For example, a marketing analyst might examine whether website visitors completed a purchase. Comparing conversion categories across campaigns can help identify differences in campaign performance.
How Does Categorical Analysis Work?
Categorical data analysis generally follows a structured process:
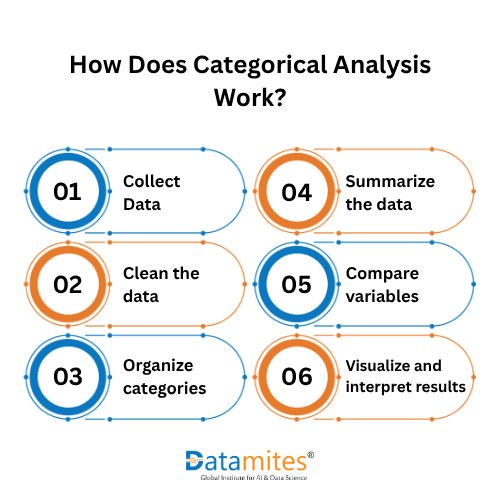
- Collect data: Gather information from customer surveys, CRM platforms, sales transactions, or business databases.
- Clean the data: Standardize category labels, remove duplicate records where appropriate, and investigate missing values.
- Organize categories: Classify observations into consistent groups, preserving meaningful category order where necessary.
- Summarize the data: Calculate frequencies, percentages, and proportions for each category.
- Compare variables: Examine differences between groups using cross-tabulation or suitable statistical tests.
- Visualize and interpret results: Use charts and dashboards to communicate findings and support business decisions.
For instance, a company can compare customer satisfaction categories across different service locations to identify where customer experiences vary. The U.S. Census Bureau's Statistical Quality Standard E1 illustration is relevant for data-analysis planning, checking assumptions, validating calculations, and documenting methods. Link to the specific standard rather than only mentioning the organization.
Common Categorical Data Analysis Methods
Data analysts use various categorical data analysis methods to summarize category distributions, identify relationships between variables, and uncover meaningful patterns that support data-driven business decisions.
1. Frequency Distribution
A frequency distribution shows how often each category appears in a dataset. Analysts can also calculate percentages to compare categories across groups of different sizes.
Percentage= {CategoryFrequency/TotalObservations}*100
For example, a retailer can calculate the percentage of orders belonging to electronics, clothing, and home appliances to understand its product sales mix.
2. Cross-Tabulation
Cross-tabulation compares two categorical variables in a table. A marketing analyst could compare campaign type with purchase status to investigate whether conversion patterns differ between campaigns.
RowPercentage= {CellFrequency/RowTotal} * 100
For example, a marketing analyst might compare campaign type with purchase status.
| Marketing campaign | Purchased | Did not purchase | Total |
| 30 | 70 | 100 | |
| Social media | 45 | 105 | 150 |
| Total | 75 | 175 | 250 |
The purchase conversion rate for each campaign is calculated by dividing purchases by the total number of observations in that campaign.
Email conversion rate = 30 / 100 × 100 = 30%.
Social media conversion rate = 45 / 150 × 100 = 30%.
In this illustrative dataset, both campaigns have the same observed conversion rate. Cross-tabulation makes such comparisons easier and can be followed by an appropriate statistical test when the research question requires it.
Row percentages, column percentages, and appropriate statistical tests can help interpret these comparisons.
3. Chi-Square Test
The chi-square test of independence evaluates whether two categorical variables are statistically associated. For example, it may help assess whether customer satisfaction categories differ by service channel.
x2 = ∑ (0-E)2 /E
Where:
O = Observed frequency
E = Expected frequency
∑ = Sum across all cells in the contingency table
Expected frequency formula:
E={Row Total *Column Total}/{Grand Total}
Fisher’s Exact Test
Fisher’s exact test determines whether two categorical variables are associated, commonly in a 2 × 2 contingency table when sample sizes are small or chi-square assumptions are not met.
Formula for a 2 × 2 table:
P=(a+b)!(c+d)!(a+c)!(b+d)!a!b!c!d!n!
Where:
a,b,c,d = Observed cell frequencies
n=a+b+c+d = Total observations
! = Factorial
Fisher’s exact test calculates the exact probability of the observed table under the null hypothesis, conditional on the table margins. Analysts should consider it when expected cell counts are small; the chi-square test may be appropriate when its assumptions are satisfied.
Analysts must check assumptions, including expected cell frequencies, before interpreting the results. An association does not automatically establish causation.
4. Mode and Proportion Analysis
The mode identifies the most frequently occurring category, while proportions show the share of observations belonging to each category.
Mode:
Mode= arg maxc f(c)
Where f(c) represents the frequency of category c.
Proportion formula:
Proportion=CategoryFrequencyTotalObservations
These measures are useful for summarizing customer preferences, common support requests, and frequently selected products.
5. Logistic Regression
Logistic regression models the probability of a categorical outcome, commonly a binary outcome such as customer churn or loan default. Analysts can use it to examine how selected explanatory variables relate to the probability of an outcome.
Formula:
P(Y=1)=11+e-z
Where:
z=0+1X1++kXk
P(Y=1) = Probability of the outcome
0 = Intercept
1,,k = Model coefficients
X1,,Xk = Predictor variables
e = Euler’s number
The model must be evaluated carefully, and its results should not be interpreted as proof of causation.
Applications of Categorical Data Analysis across Industries
Categorical data analysis helps organizations examine grouped information, compare outcomes, and identify relationships between variables. Its applications span retail, healthcare, marketing, and customer service. The methods used depend on the data, research question, and assumptions of the analysis.
1. Retail Merchandising: Understanding Product Groupings
Retailers can examine customer preferences and product classifications to assess whether merchandise categories align with shoppers’ expectations. Survey responses, product-sorting activities, and shopper feedback can provide data analytics in retail.
Depending on the research question, analysts may use frequency distributions, cross-tabulation, clustering, or similarity measures. Clustering is not itself a categorical data analysis method in every application, but it can complement categorical analysis when comparing product or customer groups.
How categorical analysis is applied: Analysts examine product classifications and customer responses to identify patterns in how shoppers perceive or group merchandise.
Key takeaway: These methods can help retailers evaluate product organization and identify areas for further research. Any proposed changes should be tested before their effects on shopping experience or sales are assumed.
2. Healthcare: Comparing Patient Groups and Treatment Outcomes
Healthcare researchers often work with categorical variables such as treatment group, disease status, recovery status, and adverse-event occurrence. Frequency tables and cross-tabulation can summarize these variables and compare outcomes between groups.
Depending on the study design and data, researchers may use chi-square tests or Fisher’s exact test to assess associations between categorical variables. More complex studies may use logistic regression to account for relevant explanatory variables and potential confounders.
How categorical analysis is applied: Researchers compare outcome distributions across patient or treatment groups and assess whether the observed differences provide statistical evidence of an association.
Key takeaway: Categorical data analysis supports the interpretation of data analytics in healthcare research findings. Statistical associations alone do not establish treatment effectiveness or prove causation; conclusions must consider study design, uncertainty, and potential confounding factors.
3. Marketing: Comparing Campaign Responses
Marketing teams can classify campaign outcomes into categories such as converted and not converted, and group acquisition channels into organic search, paid search, email, or social media. Cross-tabulation can compare conversion counts and proportions across these groups.
When assumptions are satisfied, a chi-square test may help assess whether conversion status is associated with the acquisition channel. Logistic regression can also estimate conversion probability while accounting for relevant variables.
How categorical analysis is applied: Analysts compare response categories across campaigns or customer segments and evaluate whether observed differences warrant further investigation.
Key takeaway: Categorical analysis helps marketers summarize campaign outcomes and compare audience segments. Decisions should also account for sample sizes, campaign costs, attribution limitations, and other relevant performance measures.
4. Customer Service: Analyzing Feedback and Complaint Categories
Organizations can classify customer feedback by sentiment, issue type, or resolution status. Frequency distributions can show how often each category occurs, while cross-tabulation can compare complaint types across service channels or reporting periods.
For example, an analyst could examine whether complaint categories differ between phone, email, and chat support. The actual findings would depend on the organization's data and the consistency of its classification process.
How categorical analysis is applied: Analysts group feedback into defined categories, calculate frequencies and proportions, and compare patterns across relevant groups.
Key takeaway: Categorical data analysis can help organizations summarize customer concerns and identify areas for further investigation. Feedback categories should be defined consistently, and conclusions should reflect the available evidence rather than assumptions about customer experiences.
What Do These Examples Demonstrate?
These Applications show that categorical analysis is more than simply counting labels. It can help organizations investigate relationships between variables, identify patterns in customer behavior analysis, and improve operational decisions. Data analysts should select methods that suit the research question, validate data quality, and distinguish statistical associations from causal relationships.
Refer to the articles below:
- What would be the Data Analyst Course Fee in India
- Data Analyst Career Scope in India
- Mastering Data Analytics in India
Tools Used for Categorical Data Analysis
Data analysts use various data analytics tools for categorical data analysis to organize, summarize, visualize, and interpret data grouped into categories. The choice of tool depends on dataset size, analytical complexity, statistical requirements, and reporting objectives. Popular tools include Microsoft Excel, SQL, Python, R, Power BI, and Tableau, each offering capabilities for analyzing categorical variables and identifying meaningful patterns.
1. Microsoft Excel for Categorical Data Analysis
Microsoft Excel is useful for performing basic categorical data analysis, particularly when working with small and medium-sized datasets. Features such as PivotTables, COUNTIF, and charts help analysts calculate category frequencies, compare percentages, and identify common patterns in customer feedback, sales records, and survey responses.
2. SQL for Analyzing Categorical Data
Structured Query Language (SQL for Data Analytics) helps analysts retrieve and summarize categorical data stored in relational databases. Commands such as GROUP BY, COUNT(), and conditional aggregation can be used to compare product categories, customer segments, and transaction types across large datasets.
3. Python for Statistical Categorical Analysis
Python supports more advanced categorical data analysis through libraries such as pandas, SciPy, and statsmodels. Pandas helps clean categorical variables and calculate frequency distributions, while SciPy and statistics models provide statistical techniques for analyzing relationships between categorical variables. For example, analysts can use a chi-square test to assess whether customer satisfaction is associated with a particular service channel, provided the test assumptions are satisfied.
4. R for Categorical Data Statistics
R is a statistical programming language used for hypothesis testing, statistical modeling, and data visualization. Its statistical functions and specialized packages help analysts examine categorical variables, test associations, and interpret results in research and business analytics.
5. Power BI and Tableau for Categorical Data Visualization
Power BI and Tableau help transform categorical analysis results into interactive dashboards and visual reports. Analysts can use bar charts, stacked charts, and filtered dashboards to compare customer segments, product categories, and survey responses. These visualizations help stakeholders understand category distributions and identify patterns that require further investigation.
How to choose the right tool: Excel is suitable for quick summaries, SQL for database-level analysis, Python for Data Analysis and R for statistical analysis, and Power BI or Tableau for interactive reporting. Combining these tools can help data analysts build a more efficient workflow, from data preparation and statistical analysis to insight communication and business decision-making.
Best Practices for Accurate Categorical Analysis
Accurate categorical data analysis requires consistent data preparation, appropriate statistical methods, and careful interpretation of results. By following established statistical practices, data analysts can reduce errors, identify meaningful patterns, and produce reliable insights for business decision-making. The U.S. Census Bureau recommends planning analytical methods in advance, checking data quality, validating assumptions, and documenting methodological limitations. (Source: U.S. Census Bureau statistical quality standards)
To improve the accuracy of categorical analysis, data analysts should follow these best practices:
- Standardize category labels: Use consistent naming conventions to prevent identical categories from being counted separately. For example, standardize “Online,” “online,” and “Web” when they represent the same sales channel.
- Check missing values and data quality: Identify incomplete records, duplicate entries, and unexpected categories before calculating frequencies or percentages.
- Choose appropriate statistical methods: Use frequency distributions for summaries, cross-tabulation for comparing categories, and chi-square tests when their assumptions are satisfied.
- Use suitable visualizations: Bar charts and stacked bar charts can make category distributions and comparisons easier to interpret. Include clear labels and relevant totals or percentages.
- Interpret results carefully: Statistical significance does not necessarily indicate a meaningful business impact. Consider sample size, effect size, possible bias, and the context of the analysis.
- Document assumptions and limitations: Record data-cleaning steps, category definitions, analytical methods, and potential sources of error so that the analysis can be reviewed and reproduced.
- Protect sensitive information: Apply appropriate access controls and privacy safeguards when analyzing customer, employee, or patient data.
Following these practices helps make categorical data analysis more consistent, transparent, and useful for business decisions. The National Institute of Standards and Technology (NIST) also emphasizes exploratory analysis, visualization, and checking assumptions to improve understanding of datasets. For reference Read the NIST.
Refer to the articles below:
- Why Storytelling in Data Analytics Has Become a Critical Skill
- How Data Analytics Skills Open Opportunities Across Multiple Industries
- Why Data Analytics Matters in Every Career
Categorical analysis helps data analysts interpret grouped data, identify patterns, and support evidence-based business decisions. By applying suitable statistical methods and tools, professionals can improve analytical accuracy. DataMites offers data analytics training to develop practical skills for real-world applications.
DataMites Hyderabad is a professional training institute offering industry-oriented programs in Data Science, Artificial Intelligence, Machine Learning, and Business Analytics. Its learning approach emphasizes practical experience through real-world projects, internships, and placement assistance to help learners develop industry-relevant skills. With certifications associated with IABAC and NASSCOM FutureSkills, DataMites provides flexible online and classroom training options, including the Data Analyst course in Mumbai. The institute also has a presence in several major Indian cities, including Bangalore, Pune, Chennai, Hyderabad, Mumbai, Kolkata, Coimbatore, and Chandigarh, making its training programs accessible to learners across different regions.