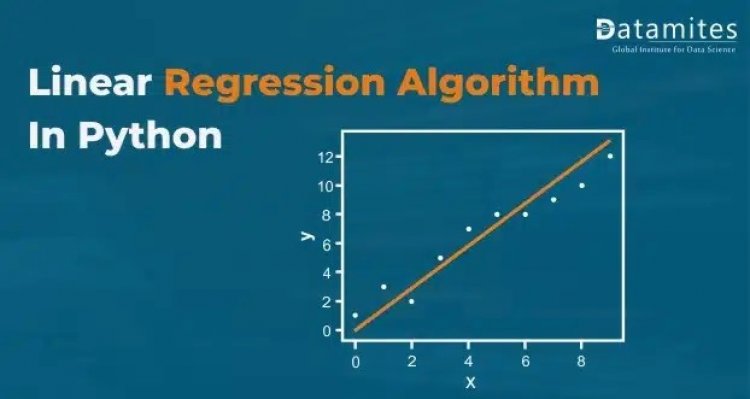
A Complete Guide to Linear Regression Algorithm in Python
The two types of supervised machine learning algorithms are regression and classification. The second predicts discrete outputs, whereas the first expect continuous value outputs. Assume that estimating the price of a property in dollars is a regression problem, and determining whether a tumour is malignant or benign is a classification problem.
There are many different types of regression algorithms in Machine Learning, such as;
- Linear Regression
- Ridge Regression
- Lasso Regression
- Polynomial Regression
- Bayesian Linear Regression
In this blog, we will go through one of the most easiest and fundamental machine learning algorithms, i.e Linear Regression. Also will learn how it can be implemented for both two variables and multiple variables using python and Scikit-Learn, which is one of the most popular machine learning libraries for Python.
Read this article to know: Support Vector Machine Algorithm (SVM) – Understanding Kernel Trick
What is Linear Regression
Linear Regression is one of the Supervised Machine Learning Algorithms. It was developed in the field of statistics so it is also a statistical algorithm. Since this algorithm shows a linear relationship between a dependent (output) and one or more independent (input) variables, it is called linear regression. Therefore it can be used to find how the value of the dependent variable is changing according to the value of the independent variable. A linear relationship is represented by a straight line called a regression line / best-fit line. This line is the pattern on which the machine has learned from the data. This algorithm is used for predicting the output of quantitative type (continuous value) such as age, salary, price, scores, etc. Mathematically linear regression can be,
y = α + β x — eq 1
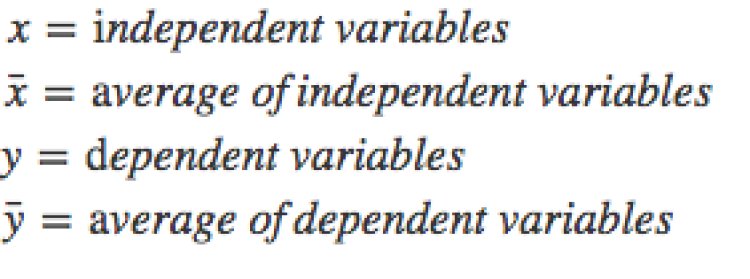
y – output *variable
x – input *variables
α and β – parameters (α is intercept or bias, β is slope or weights)
(Note: In machine learning, data can consist of more than one variable. For Supervised learning algorithms, these variables should be either input or output. Input variables are known as features or predictor variables, and output variables are known as response or target variable.)
What are the assumptions of linear regression model?
Types of Linear regression in Machine Learning
Simple Linear Regression: Here, the number of input *variables will be one and have one output variable. The equation can be obtained from eq-1,
if β = β1 and x = x1
y = α + β1 x1
here β0 can be slope associated with input single input variable x1
Since there are only two variables, this can be shown in a 2-dimensional graph. A line can be used to choose a best-fit model.
Multiple Linear Regression: There should have more than one input variable and one output variable. Mathematically this model can be obtained from eq-1,
if β = [ β1, β2, · · · βn ] and x = [ x1 , x2 · · · xn ]
y = α + β1 x1 + β2 x2 + · · · + βn xn
where, β1, β2, · · · βn is the parameters associated with
inputs x1 , x2 · · · xn and ‘n’ is the number of input variables or dimensions (i.e n-dimensional)
A model having variables with more than three axes is difficult to visualize. Here the best-fit model should be a hyperplane.
Each input variable x1, x2 · · · xn can have ‘m’ number of samples or observations, i.e each input variable is a vector of size ‘m’ having,
x1 = [ x11 , x12 · · · x1m ]
x2 = [ x21 , x22 · · · x2m ]
xn = [ xn1 , xn2 · · · xnm ]
Refer this article: A Complete Guide to Decision Tree Algorithm in Python
Various Assumptions of Linear Regression
- Linearity: Exist linear relationships between dependent and independent variables. In case of non-linearity, use transformations such as logarithmic, exponential, square root etc.
- No multicollinearity: Multicollinearity is the presence of a correlation between two or more independent (input) variables. It can be either positively or negatively correlated, i.e if an increase of a variable’s value may result in an increase of another variable’s value or a decrease of one variable results in the decrease of another variable is called positively correlation. Similarly, if the increase of one variable results in the decrease of another variable or likewise other is called negative correlation. The stronger the correlation, difficult it is for the model to estimate the relationship between each independent variable and dependent variable independently, i.e model is unable to identify which independent variable explains the dependent variable.
- Error distribution: Errors are normally distributed. If not, then the confidence interval may become too wide or narrow. So the model may not be stable in prediction.
Also Refer to the article: The Complete Guide to Recurrent Neural Network
How Linear Regression works
From the above two equations, we might get some intuition about the working of linear regression. To know more about it let’s have a practical approach.
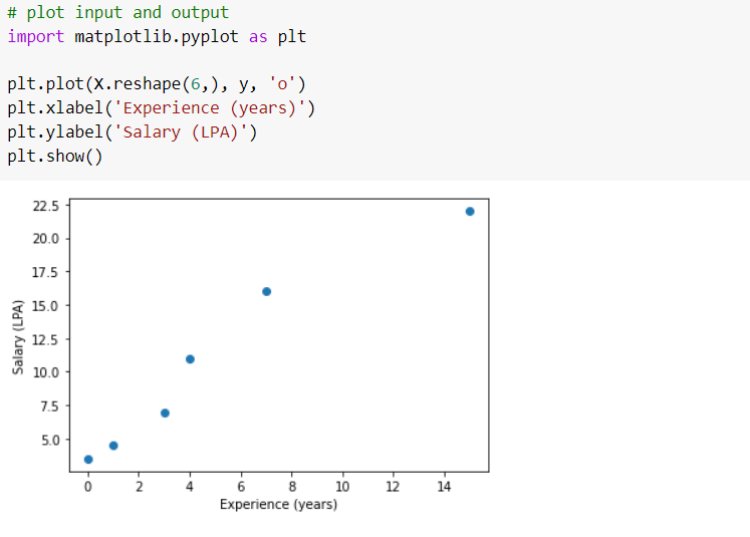
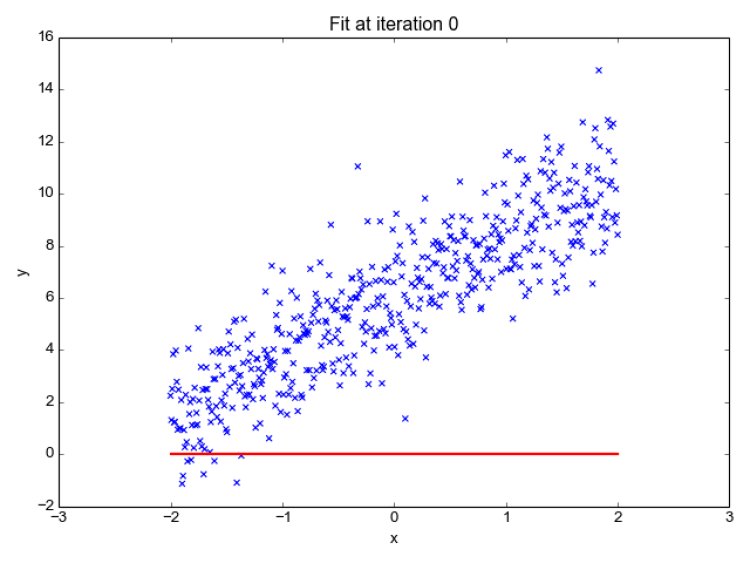
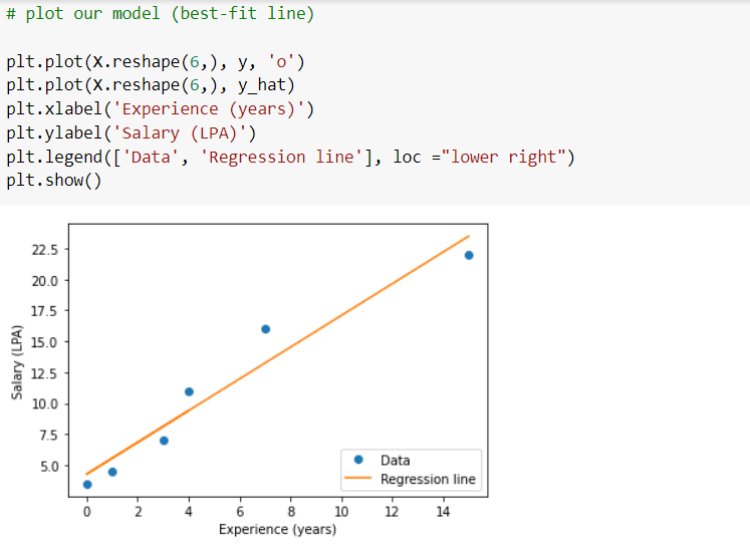
First, consider simple linear regression. Here we will make an Employee Salary prediction model based on the number of years of experience. We take only one input variable, years of ‘experience’ and ‘Salary’ in LPA is taken as output variable. We use only 6 sample data points taken by ourselves. For every value of the input variable, we have an output value. Set these points into ‘X’ and ‘y’.
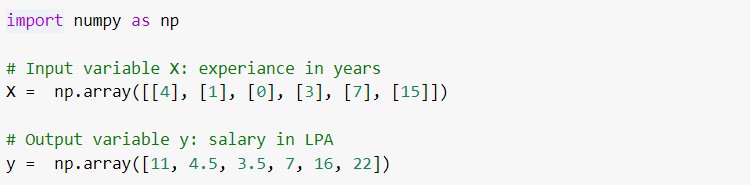
See how these data points are located from each other. We need to get a best-fit regression line for this plot.
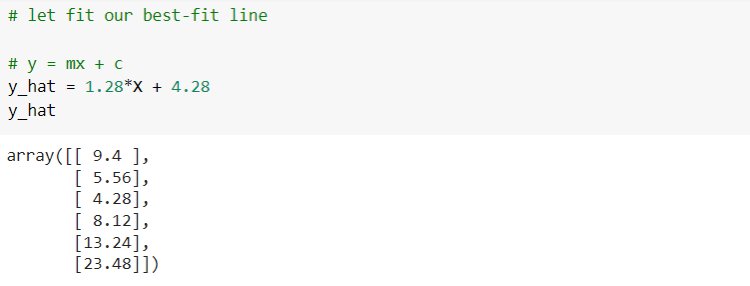
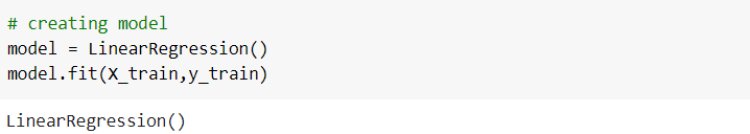
From the python sci-kit-learn library we import a linear regression algorithm and create a Linear Regression Instance. Then feed our data points into the instance results in training. A linear regression algorithm that is trained on data is our model here.
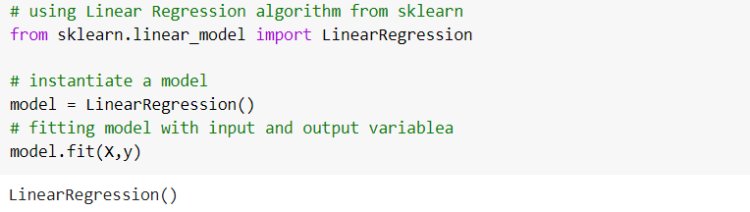
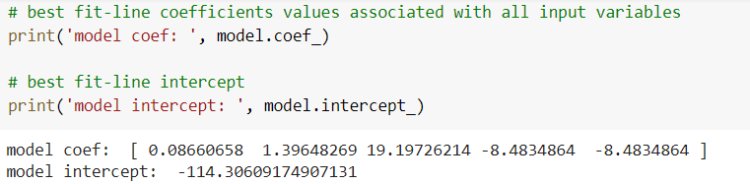
After training, we will get model parameters; coefficients and intercept that model learned from the data. These parameters play a vital role in modelling. Let us know how this learning is done.
There are mainly two approaches to training a linear regression model; using the Optimization algorithm and Ordinary Least Square (OLS) technique.
Ordinary Least Square (OLS)
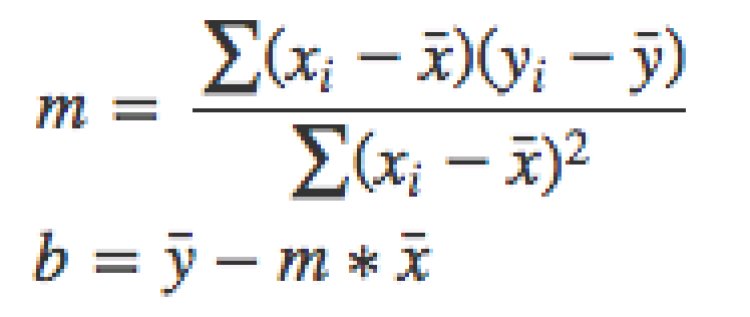
In Scikit-learn, Linear Regression follows the OLS approach. It is derived from the Gauss-Markov theorem. For a simple linear regression model, we can estimate parameter values in a much simpler statistical method. Let’s consider ‘α’ as ‘b’ and ‘β’ as ‘m’.
y = α + β1 x1
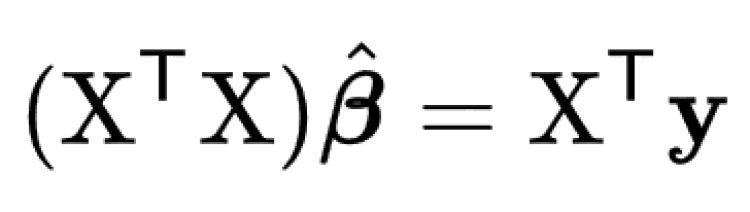
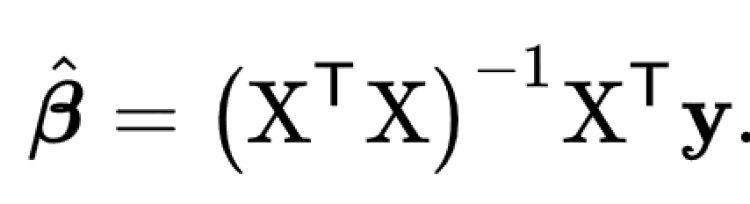
For multiple linear regression, Scikit-learn uses OLS and then Normal Equation to determine coefficients. Let our X, β and y be
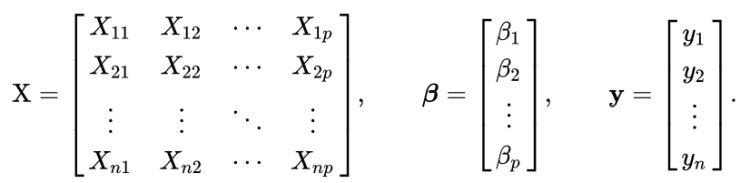
In mathematics, this given problem can be solved using a Normal Equation and β can be determined.
What is Objective Function

Optimization algorithm
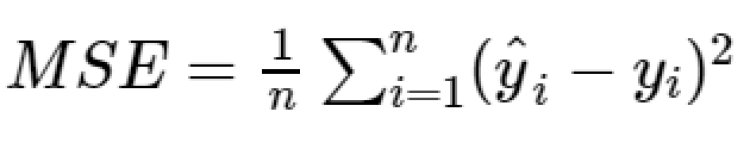
When we feed both input and output variables into the algorithm, by using a set of initial values of the parameter the algorithm calculates output for the given input data. Then a cost function will calculate the error or difference by comparing estimated output with actual output. A cost function is a mathematical function that signifies how much the estimated (predicted) values deviate from the actual values. Mean Squared Error (MSE) is the most commonly used cost function for Linear Regression. MSE is the average of the sum of the squared difference between the predicted and actual value. The output of MSE is the single number representing the cost.
The next step is to reduce this cost in order to get optimum values for model parameters. Or we can say the model will try to find optimum parameter values that have the lowest cost (error). These optimal parameter values are used to get a best-fit regression model (or line in a plane). Finding optimal value is done by the optimization algorithm. It minimizes the cost function. It’s based on a convex function and tweaks its parameters iteratively to minimize a given function to its global minimum. This helps to get the optimal value for the slope m which provides the best fit line.
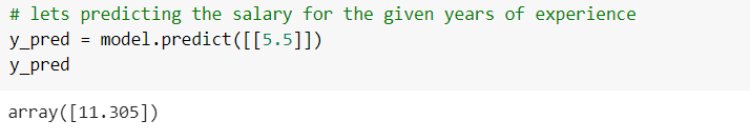
By getting optimal parameters, the best-fit regression model can be fixed and used for predicting output for unseen input data. Below you will see the best-fit line for our problem case.
What is Heteroscedasticity

Multiple Linear Regression
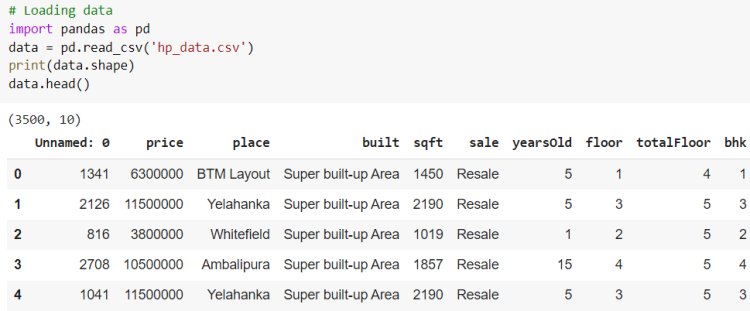
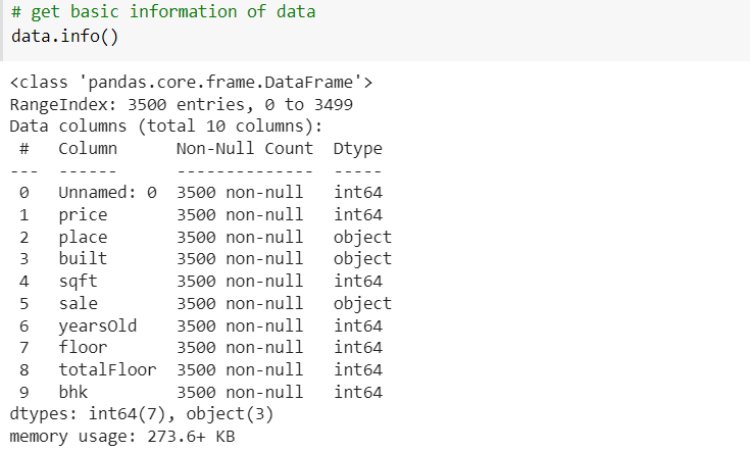
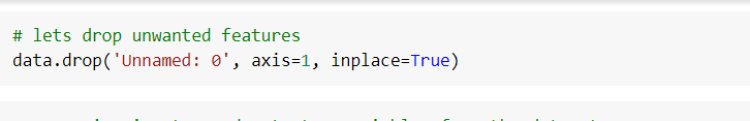
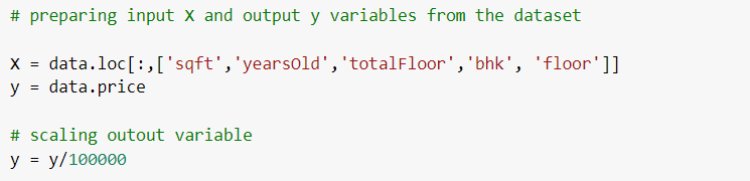
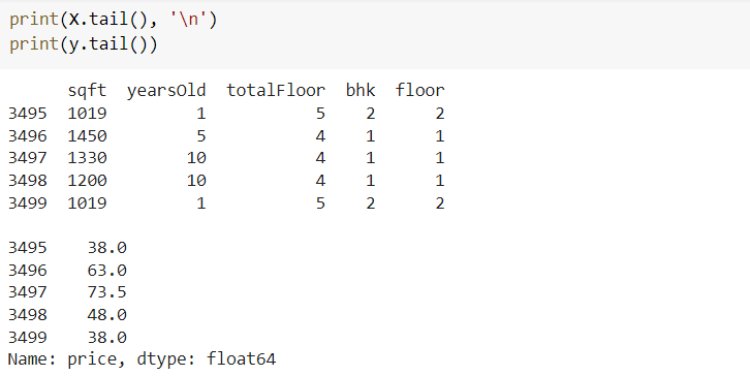
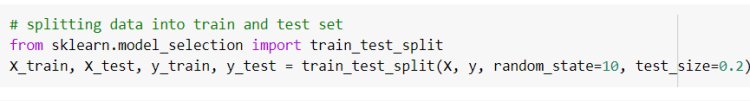
Next, we have an implementation of linear regression that uses multiple input variables. This is very similar to simple linear regression implementation. Here we use the House price dataset from Kaggle.
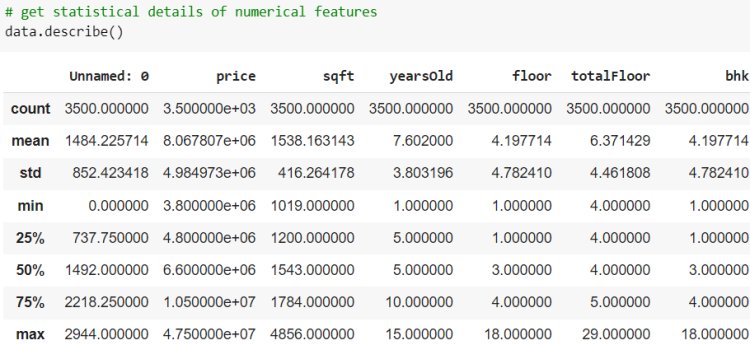
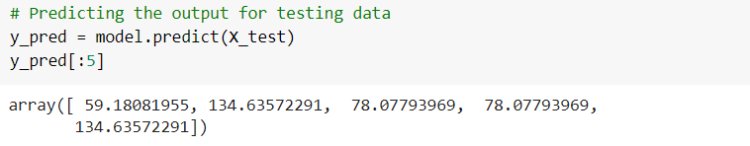
Let’s evaluate the performance of the model by comparing the predicted output and actual output using sklearn Evaluation metrics.
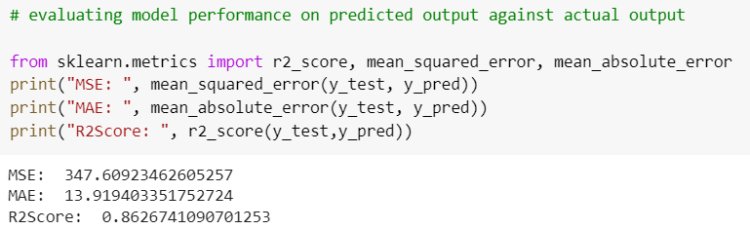
Evaluation Metrics measure how good our model performs. Commonly used metrics are Mean Squared Error (MSE), Root Mean Squared Error (RMSE), Mean Absolute Error (MAE) and R-Squared (Coefficient of Determination).
Mean Squared Error is the average sum of the squared difference between the predicted and actual value. MSE penalizes the error.
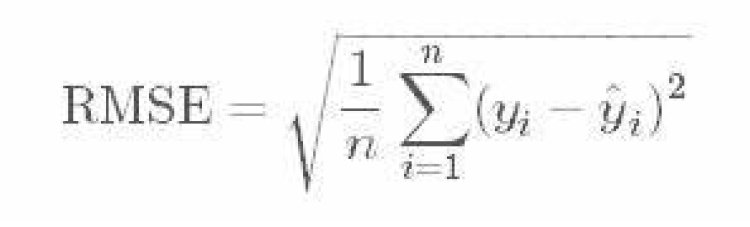
Root Mean Squared Error takes the root of MSE.
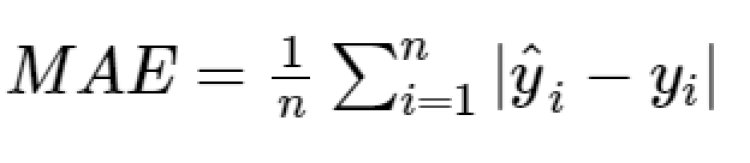
Mean Absolute Error is the average absolute difference between the predicted and the actual value. It does not penalize the error.
R-Squared is the most important metric to represent the goodness of our model. It is the percentage of variation in the dependent variable that a linear model explains.
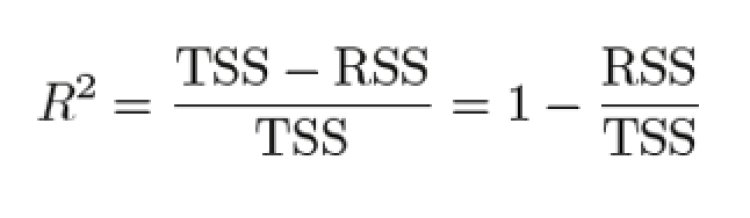
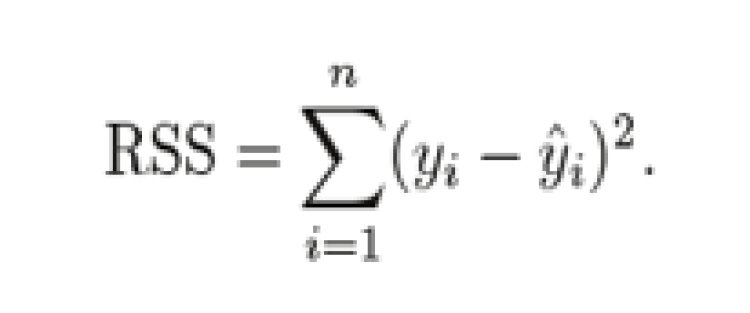
Where RSS stands for Residual Sum of Squares and TSS stands for Total Sum of Squares,
![]()
Pros of Linear regression
- Simple and easy to understand compared to other machine learning algorithms.
- Easy to implement and operation is fast.
Cons of Linear regression
- Very sensitive to outliers: often leads to a model with low accuracy.
- It performs well for linearly separable datasets. So not recommended for most real-world applications as it produces simplified results assuming linear relationships between the data.
Some of the Linear Regression applications
- Drug dosage: This technique to understand the relationship between drug dosage and the blood pressure of patients.
- Sales forecasting: Linear regression models are often used by Organizations to forecast sales in future.
- Cash forecasting: Many businesses use linear regression to forecast how much cash they’ll have on hand in the future
- Weather forecasting: Linear regression has been used for forecasting the minimum and maximum temperature and wind speed.
Conclusion
We covered the theoretical and practical approaches of linear regression both Simple and Multiple linear regression. Now you might have gotten the basic idea about the Linear Regression algorithm and its implementation.
Being a prominent data science institute, DataMites provides specialized training in topics including machine learning, deep learning, Python course, the internet of things. Our artificial intelligence at DataMites have been authorized by the International Association for Business Analytics Certification (IABAC), a body with a strong reputation and high appreciation in the analytics field.
Autoregression