Understanding Auc Roc Curve

What is the history of the ROC Curve?
The ROC curve was initially created by electrical and radar engineers during World War II to identify enemy objects on the battlefield. It was quickly adopted by psychology to explain how stimuli are perceived. Since then, ROC analysis has been applied in numerous fields, including medicine, radiology, biometrics, natural disaster predicting, meteorology, model performance evaluation, and others. It is also increasingly employed in machine learning and data mining research.
Now let’s define ROC:
Selecting the best statistic for a machine learning binary classification problem is a challenging task. A value between 0 and 1 is produced by several classification systems using the probabilistic approach. We then added a threshold on the top to wrap up the outcome. A receiver operating characteristic curve, often known as a ROC curve, is a graphical figure that shows how a binary classifier system’s diagnostic capacity changes as the discrimination threshold are altered. The technique’s name comes from the fact that it was initially created for users of military radar sensors beginning in 1941.
A graph showing the relationship between the False Positive Rate (FPR) and True Positive Rate (TPR) is called the ROC curve. Sensitivity and recall are additional terms for the true-positive rate. The chance of a false alarm, commonly known as the false-positive rate, can be computed as (1 – specificity), where specificity is the true negative rate (TNR). It can also be considered a plot of the power as a function of the decision rule’s Type I Error (when the performance is calculated from just a sample of the population, it can be thought of as an estimator of these quantities). The sensitivity or recall as a function of fall-out is thus represented by the ROC curve.
As we can see, new terminologies (like TPR, and FPR) are popping out as we are moving ahead. Let us understand them in detail.
Refer to the article: Support Vector Machine Algorithm (SVM) – Understanding Kernel Trick
Confusion Matrix:
Before that, let me just give a glimpse of the confusion matrix. It is, in fact, a performance indicator for a classification problem using machine learning, the output of which can be two or more classes. There are four possible anticipated and actual value combinations in the table.
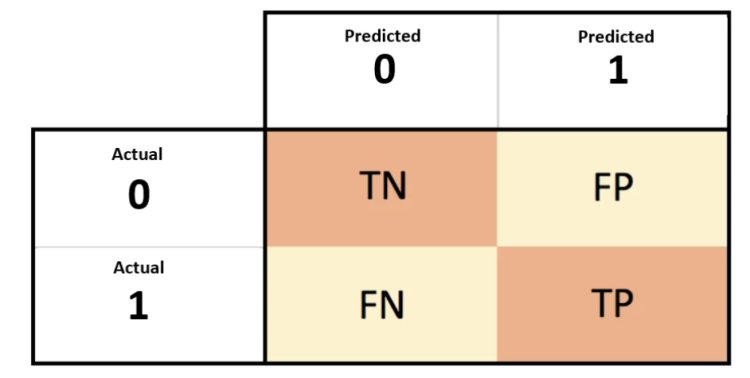
- TN - It stands for True Negative which means, Predicted as Negative, and actual is also negative.
- FP - It stands for False Positive which means, Predicted as Positive but actual is Negative.
- FN - It stands for False Negative which means, Predicted as Negative but actual is Positive.
- TP - It stands for True Positive which means, Predicted as Positive, and actual is also Positive.
- TPR (True Positive Rate) or Recall or Sensitivity = TP / (TP + FN)
- TNR (True Negative Rate) or Specificity = TN / (TN + FP)
- FPR (False positive rate ) = 1 – TNR
= FP / (TN + FP)
Read this article: 10 Python Built-in Functions
Understanding the performance of the model:
AUC close to 1, which indicates a high level of separability, is a sign of an excellent model. An AUC close to 0, which indicates the worst measure of separability, indicates a poor model. In actuality, it indicates that it is reversing the outcome. It predicts 0s as 1 and 1s as 0. Additionally, if AUC is 0.5, the model has no capacity for class separation.
In short, the understanding of the Roc curve can be summarized as :
An increase in the X-axis value corresponds to a greater proportion of false positives than false negatives. A larger Y-axis value, however, denotes a greater proportion of True positives compared to False negatives. The capacity to strike a balance between False Positives and False Negatives will therefore influence the threshold selection.
Refer this article to know: What is a Gradient Descent?
The character of AUC-ROC:
The preferred statistic for assessing the effectiveness of classification model performance is AUC-ROC. The AUC-ROC metric unquestionably helps in assessing and educating us about a model’s ability to classify data. Higher AUC indicates a better model, according to the judging standards. The relationship and trade-off between sensitivity and specificity for each feasible cut-off for a test being conducted or a set of tests being performed are typically represented graphically using AUC-ROC curves. The benefit of utilizing the test for the underlying question is indicated by the area under the ROC curve. AUC-ROC curves are another performance indicator for classification issues at various threshold levels.
A test’s AUC-ROC curve can also be used as a benchmark to assess the test’s discriminative power, which indicates how effective the test is in a certain clinical setting. The efficiency of a test will increase as the AUC-ROC curve approaches the upper left corner. We can calculate the True Positive Rate and False Positive Rate separately using various thresholds for the logistic regression, then plot them on a single graph to aggregate them into a single metric. The area under this curve, or AUC-ROC, is the resulting curve statistic that we take into account.
Also read this article: Exploratory Data Analysis
Implementation of AUC ROC curve in Python
Python makes it simple to compute AUC-ROC. To investigate any potential differences in the scores, the metric can be applied to several machine learning models. The same has been incorporated into two models, in this case, the logistic regression, and the Gaussian naive bias.
For the experiment purpose, I have used the diabetes dataset. After reading the file in my memory, I applied the train test split for dividing the data into train and test parts.
Let’s see the ROC curve for a random model.
random_test_pred = [0 for i in range(len(y_test))]
fpr_random,tpr_random,thresholds_random = roc_curve(y_test,random_test_pred)
plt.plot(fpr_random,tpr_random,label = ‘ROC curve of random model’)
plt.xlabel(‘FPR’)
plt.ylabel(‘TPR’)
plt.legend()
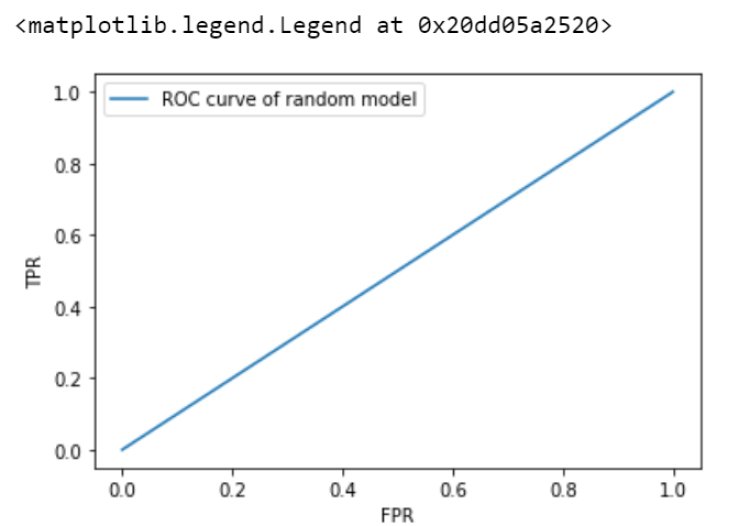
print(“Auc value for random model is”,auc(fpr_random,tpr_random))
![]()
It is clear from the above graph,that at any threshold value,the FPR is equal to TPR,hence data has no class separation capacity whatsoever.
Let us see what the ROC curve looks like when the logistic regression model is applied.
from sklearn.linear_model import LogisticRegression
log_reg = LogisticRegression()
log_reg.fit(x_train,y_train)
y_test_pred_lr = log_reg.predict_proba(x_test)
y_test_pred_lr = y_test_pred_lr[:,1]
fpr_lr,tpr_lr,thresholds_lr = roc_curve(y_test,y_test_pred_lr)
plt.plot(fpr_lr,tpr_lr,label = “Logistic Regression”)
plt.xlabel(“FPR”)
plt.ylabel(“TPR”)
plt.legend()
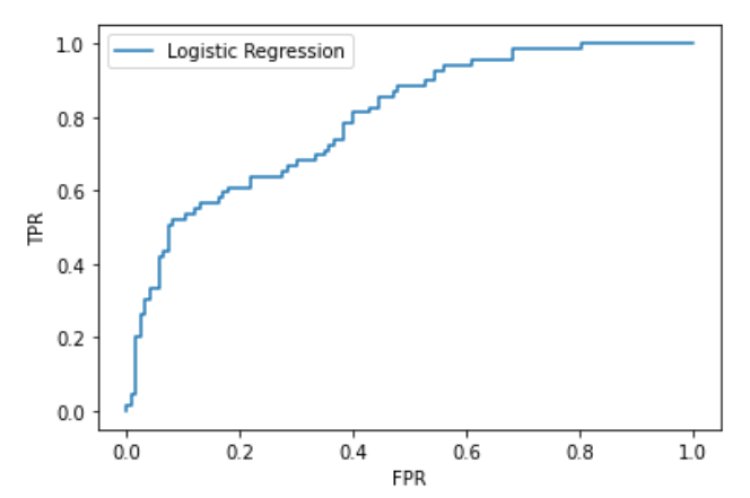
Checking the AUC value for Logistic Regression:
auc(fpr_lr,tpr_lr)
![]()
Now let’s see what the ROC curve looks like when the Naïve Bayes model is applied.
nbclassifier = GaussianNB()
nbclassifier.fit(x_train,y_train)
y_test_pred_NB = nbclassifier.predict_proba(x_test)
y_test_pred_NB = y_test_pred_NB[:,1]
fpr_NB,tpr_NB,thresholds_NB = roc_curve(y_test,y_test_pred_NB)
plt.plot(fpr_NB,tpr_NB,label = ‘Naive Bias’)
plt.xlabel(‘FPR’)
plt.ylabel(‘TPR’)
plt.legend()
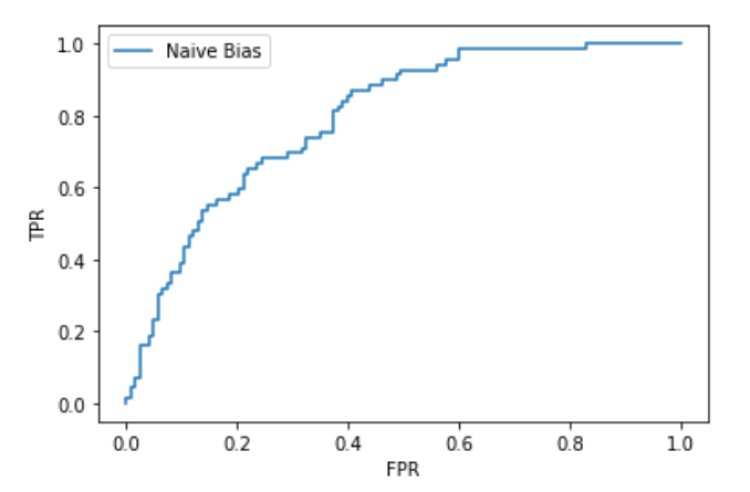
Checking for the AUC value for Naïve Bayes:
print(auc(fpr_NB,tpr_NB))
![]()
Checking for both the Models on the same plot:
plt.plot(fpr_lr,tpr_lr,label = ‘logistic regression’)
plt.plot(fpr_NB,tpr_NB,label = ‘Naive Bias’)
plt.xlabel(‘FPR’)
plt.ylabel(‘TPR’)
plt.legend()
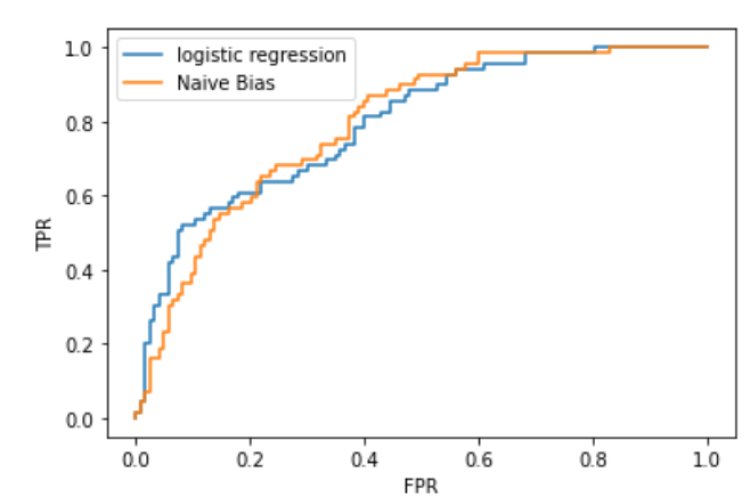
ROC Curve and AUC Score

Conclusion:
An important method for assessing the effectiveness of a developed classification model is the AUC-ROC. By carrying out this test, a model’s value and correctness are only increased, which enhances its accuracy. The actual trade-off between the true positive rate and the predictive value for a predictive model employing various probability thresholds, which is a crucial feature of classification problems, is summarized using this method.
We defined a performance metric and investigated the AUC-ROC curve, a classification metric. Through a straightforward example, we were able to understand why it should be employed and how it may be carried out using Python. The reader is invited to learn more about the subject because it is crucial to the development of a categorization model.
Being a prominent data science institute, DataMites provides specialized training in topics including ,artificial intelligence, deep learning, Python course, data analytics, the internet of things. Our machine learning course at DataMites have been authorized by the International Association for Business Analytics Certification (IABAC), a body with a strong reputation and high appreciation in the analytics field.
Precision and Recall