Instructor Led Live Online
Self Learning + Live Mentoring
In - Person Classroom Training


Tableau has made a name for itself in the business intelligence sector as a powerful and rapidly expanding data visualization software.
Tableau Server
Tableau Desktop
Tableau Public
Tableau Online
Tableau Reader
Tableau is a visual business intelligence and analytics platform that enables users to watch, observe, understand, and act on a variety of data. Without the use of programming, it enables you to make any kind of graph, plot, or chart.
Real-time data analysis
Visual representations of searches are created using the Tableau application.
Information tracking is another use for it.
The Tableau program can import data in a wide range of formats.
Because it enables non-technical users to create "no-code" data queries, Tableau is a lifesaver.
Collaboration on Data Blending and Data Visualization for Business Intelligence
The query's graphic representation
Handles massive volumes of metadata
Data from various sources can be connected to and retrieved using the data visualization application Tableau. It can retrieve information from every platform you can think of. In addition to cloud databases, Tableau can extract data from any database, including simple spreadsheets and sophisticated databases like Oracle.
With the help of the spreadsheet program Excel, you can perform a number of calculations, statistical operations, and data analyses. You can perform tasks like queries, reports, and online analytical processing and analytics using Tableau, a platform for business intelligence.
When compared to other self-service BI products, Tableau stands out for the quality of its data visualizations and self-service analytics. A variety of data sources can be easily accessed with Tableau. It is connectable to over 40 different sources. Excel spreadsheets and lovely graphics are therefore acceptable.
Tableau is becoming more and more well-liked as a result of its capacity to create dashboards and worksheets that facilitate quicker data analysis and visualization. Using Tableau, we can create dashboards that provide insights that can be used to advance the development of our business.
Pat Hanrahan, Chris Stolte, and Christian Chabot founded Tableau in 2003 while they were students at Stanford University.
Tableau assists businesses in decision-making through the use of data visualization tools, which are accessible to users from a variety of backgrounds and industries. It helps organizations stay ahead of the technological curve and beat their competitors by enabling them to visualize their data in new ways.
To prepare, analyze, collaborate on, and share huge data insights, use Tableau, a fully featured data analytics program. Tableau is the industry pioneer in self-service visual analysis and enables users to instantly share their findings throughout the organization and pose new inquiries regarding controlled large data.
The data visualization and business intelligence (BI) tool Tableau is rapidly evolving. It's simple to set up, simple to use for clients, and simple to learn. You can learn Tableau by following the program's step-by-step instructions. Beginners are advised to adhere to this instruction to the letter.
Tableau Consultant.
Data Analyst.
Business Analyst.
Business Intelligence Developer.
Business Intelligence Analyst.
Business Intelligence Manager.
Tableau aids analytics teams in better understanding and presenting data, enhancing the organization's overall data scientist skill sets. It's also great for quickly putting together reports when they are needed without having to manually create graphics. Analytics teams may explore data in-depth, detect hidden trends, and present their findings in an appealing way with the aid of Tableau. The best tool for swiftly investigating, splitting up, and dynamically presenting data is Tableau.
In today's competitive IT industry, the data visualization tool Tableau is one of the most sought-after options. It should come as no surprise that as society gets more and more data-centric, demand for Tableau developers has increased. The fact that even small enterprises are willing to provide qualified candidates a competitive compensation is astonishing. For the ninth year in a row, business intelligence and data visualization have been ranked as the top technologies by Gartner.
It's beneficial to learn tableau. When applying for positions in the data business, having knowledge of Tableau, a commonly used data visualization platform, will give you an advantage.
Learning Tableau is wonderful because even if you don't have a technical background, you can pick it up quickly. I advise that you have a fundamental understanding of SQL, even if no coding expertise is necessary. There is not much hardware needed for Tableau Desktop.
Depending on the amount of teaching you require, Tableau courses in Kolkata range in price. Depending on the training company you choose, the price for your Tableau classroom training will range from INR 20,000 to INR 40,000.
One of Tableau's best qualities is how easy it is to use. without any prior programming or technical experience.
As per Indeed.com, the national average salary for a Tableau Developer in Kolkata is INR 4,64,238 per year.
Although Power BI offers many more data points for data visualization than Tableau, the latter is better renowned for its data visualization features. Although Tableau BI can manage a smaller volume of data than Power BI, it can do it much faster.
The Tableau Course Fee worldwide shall range from:
USA - 137.26 USD to 486.93 USD
Europe - 121.15 Euro to 429.77 Euro
Canada - 173.53 CAD to 615.61 CAD
Australia - 191.38 AUD to 678.91 AUD
Germany - 121.15 Euro to 429.77 Euro
Switzerland - 127.13 CHF to 451.00 CHF
UAE - 504.15 AED to 1788.49 AED
Saudi Arabia - 515.22 SAR to 1827.75 SAR
South Africa - 2143.86 ZAR to 7605.36 ZAR
The International Association of Business Analytics has certified DataMitesTM, a global institute for data science (IABAC).
Over 25,000 students enroll in our courses.
There are three stages to the learning process. During Phase 1, the applicants will get books and videos for independent study to help them comprehend the subject. Phase 2 of rigorous live online education is the second and most significant level. We will also discuss the projects and placements from the third phase.
The course includes case studies that are both extremely significant and real-world projects.
You will be awarded the IABAC certification, which is a worldwide qualification, after the training.
You will have the opportunity to participate in an internship with the worldwide technology business, an AI company, after completing your training.
Tableau makes data exploration, experimentation, correction, preparation, and visualization simple, fast, and beautiful. Here are some of the Top Tableau Certifications:
Certified Visual Analytics Expert
Tableau Expert Training
Tableau Associate Training
The Certified Visual Analytics Expert Training in Kolkata is an advanced-level training with the goal of imparting both academic and practical Tableau knowledge. It covers the foundations of visual analytics as well as visualization methodology and best practices. It would be helpful to enroll in DataMites Certified Visual Analytics Expert Training in Kolkata.
DataMites Tableau Associate is an introductory course that combines practical experience with a basic understanding of visual analytics and the most important Tableau features. We at DataMites offer affordable training from Tableau Certified Associate experts.
A professional in the field of tableau who is proficient in using the technology for data visualization and business intelligence is known as a tableau expert.
Tableau Certified Associates are experts at using Tableau's features for data analysis and problem-solving. In more complex data analysis, they might use their mapping, data preparation, and mathematical skills. At DataMites, we offer thorough training from the greatest instructors in the business at competitive prices to become a Tableau Certified Associate.
DataMites Tableau Expert Course in Kolkata is a high-level course that combines knowledge of Tableau Desktop with practical experience. At DataMites, we provide rigorous Tableau Expert training taught by business professionals at a reasonable cost.
For three months, DataMites will host Tableau Certification Training in Kolkata. On weekdays and weekends, training sessions are held. Depending on your availability, you can pick any.
User-friendliness
There is a big demand for Tableau professionals.
Numerous Job Possibilities
A secure job
Improved Data Manipulation and Integration
High-Paying
The Tableau Course Fee in Kolkata will range from Rs.10,148 INR to Rs.36,000 INR. The Tableau Certification Fee in Kolkata may vary depending on the course and mode of training you choose.
Certified Visual Analytics Expert - 36,000 INR
Discounted Price - 18,348 INR
Tableau Associate - 21,000 INR
Discounted Price - 10,148 INR
Tableau Expert - 36,000 INR
Discounted Price - 18,348 INR
Tableau training is available offline at DataMites in the Indian cities of Bangalore, Chennai, Pune, and Hyderabad. In other situations, we are pleased to provide students with classroom instruction in Tableau ON-DEMAND.
With our Flexi-Pass for Tableau Certification Training in Kolkata, you get three months to attend sessions from DataMites pertaining to any question or examination you wish to pass.
We will award you with an IABAC® certification, ensuring that your relevant skills are widely recognized.
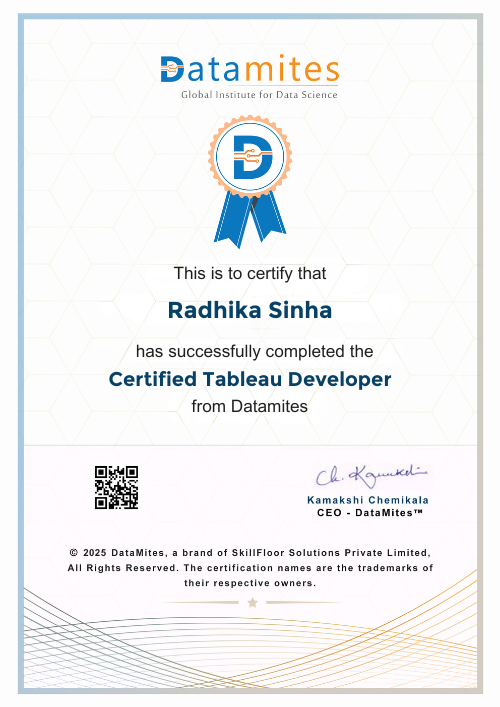
Naturally, once your training is over, we will give you a Tableau Course Completion Certificate.
It is crucial that you maximize your training sessions, no doubt about it. If you require any additional clarity, you can, of course, request a support session.
We are committed to offering you trainers who are highly qualified, certified, have a lot of experience in the field, and are knowledgeable about the material.
Yes. The participation certificate must be issued and the certification exam must be scheduled using photo IDs such as a national ID card, driver's license, etc.
Simply get in touch with your instructors and arrange a lesson time that works for you. Online Tableau Training in Kolkata will record and upload each session so that you can simply catch up on what you missed at your own pace and comfort.
DataMites uses the case study method of instruction to complement academic knowledge with practical understanding. to be specific;
Model Deployment, Case Study, Project, and Theory
Yes, a free trial class will be offered to you so that you can have a taste of what the training entails and how it will be conducted.
Payment can be made by using;
Master card
Credit Card
Cash
Net Banking
Check
Debit Card
PayPal
Visa
American Express
The DataMites Placement Assistance Team(PAT) facilitates the aspirants in taking all the necessary steps in starting their career in Data Science. Some of the services provided by PAT are: -
The DataMites Placement Assistance Team(PAT) conducts sessions on career mentoring for the aspirants with a view of helping them realize the purpose they have to serve when they step into the corporate world. The students are guided by industry experts about the various possibilities in the Data Science career, this will help the aspirants to draw a clear picture of the career options available. Also, they will be made knowledgeable about the various obstacles they are likely to face as a fresher in the field, and how they can tackle.
No, PAT does not promise a job, but it helps the aspirants to build the required potential needed in landing a career. The aspirants can capitalize on the acquired skills, in the long run, to a successful career in Data Science.


