4.9 (22,780) reviews
Instructor Led Live Online
Self Learning + Live Mentoring
Customize Your Training
AI is the future, and DataMites helped me step into it! The online Data Science course was easy to follow, and the tutors explained everything clearly. Even after completing my course, the team supported me with placements and I successfully cracked a job! Grateful to DataMites for shaping my career.
I joined DataMites to learn Data Science and gained strong skills in ML, DL, and Statistics. Through my internship at Rubixe AI Solutions, I worked on real-world projects, which helped me land job interviews and an offer. The trainers were very supportive and explained every concept clearly. Thanks to DataMites, my data science journey was smooth and successful.
My mentor, a DataMites alumnus, suggested I join the Data Science course, and it was one of my best decisions! The offline classes were interactive and full of guidance, and I got the chance to intern at Rubixe AI Solutions. The placement team was very supportive and helped me perfect my resume. Truly thankful to DataMites for this amazing learning journey.
I joined DataMites after completing my engineering in Computer Science and became a Certified Data Scientist. With their support, I completed an internship at Rubix AI Solutions and now work as an AI intern at Inventor Hub. DataMites made learning statistics and data science easy with clear guidance and great materials. I’m truly thankful for their support.
I joined DataMites for the Certified Data Scientist online course, and it was a great experience! The real-time projects helped me apply my learning practically, and the placement support added real value to my career restart after 8 years. DataMites is the perfect platform to learn, grow, and begin your data science journey.
I joined DataMites for the Data Science course and learned Python, SQL, Machine Learning, and Deep Learning through hands-on projects. The trainers are excellent at explaining concepts clearly. The placement team is very supportive and provides great opportunities thanks to DataMites for helping me start my data science journey.
I joined DataMites after my B.Tech when I developed an interest in Data Science and Machine Learning. The training was well-structured, and I even got an internship opportunity that helped me gain real experience. The placement team was super supportive and guided me through every step. Thanks to DataMites, I’m now placed at Horizon Broadband Pvt. Ltd.
I joined DataMites after completing my BCA, and it was the best decision for my data science career! I learned Python, SQL, Machine Learning, Deep Learning, and NLP, and worked on several capstone and client projects that gave me real-world experience. The trainers and team were always friendly and supportive, patiently clearing all my doubts. Thanks to DataMites, I’m confident and job-ready in data science
I started my data science journey with DataMites, and it’s been an amazing experience! The Certified Data Scientist Program helped me learn everything from scratch through hands-on projects and an internship. The placement team was incredibly supportive, always ready to clarify my doubts. Thanks to their guidance, I successfully got placed. Highly recommend DataMites to anyone starting their data science career
Enrolling at DataMites was one of the best decisions I made for my career. Coming from a freelance writing background with no prior technical experience, I was initially unsure about stepping into the field of data analytics. But DataMites made the transition smooth and achievable. I’d highly recommend them to anyone looking for a guided, industry-ready data analytics course. A true DataMites success story!
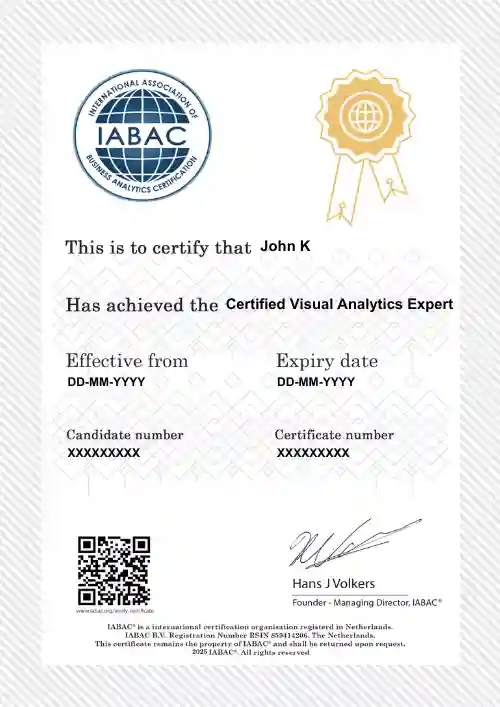
Certified Visual Analytics Expert (CVAE) is an authorized course from International Association of Business Analytics Certifications. This course is designed to provide a Visual Analytics knowledge with global standards and uses Tableau as tool for creating Visualization and Analytics reporting.
CVAE is a expert level course, which is designed to provide master knowledge on both Visual Analytics theory and hands on with Tableau. This course also covers a case study of creating complete reporting and visualzation for an organisation. After this course, you should able to manage any visualization or reporting tasks with Tableau Desktop.
This course objective is to provide an expert knowledge on Visual Analytics skills to design and manage the entire visualization for a business. The candidates should be thorough with below Tableau topics.
This course - Certified Visual Analytics Expert is designed to impact expert skills on Visual Analytics and hands-on mastery of Tableau 10.4. Everything you need to design and manage the entire visualizations for an organization is covered in this training.
This is an expert level course and anyone who is serious in pursuing a career in Visual Analytics can opt for this course.
This course will help you to gain substantial knowledge in the field of Visual Analytics along with hands-on with Tableau 10.4 in the most effective manner.
At DataMites™, we truly believe and very excited about this big wave of Data Science. DataMites™ work with globally renowned Machine Learning experts in designing as well delivering training course.We also deliver Articifial Intelligence consulting project to our European clients.
DataMites is founded by a group of passionate Data Science evangelists with decades of experience in Analytics, big data and Data Science working with fortune 100 companies, across the globe. The mission of DataMites™ is enable data science professionals with strong data science skills aligned market requirements and be a part of this phenominal Data Science era.
Tableau is a powerful data visualization and business intelligence tool that helps users analyze and present data in a visually appealing and interactive way.
Learning Tableau is essential because it enables individuals and organizations to make data-driven decisions, gain insights from complex datasets, and communicate findings effectively to stakeholders.
The key skills of Tableau include data visualization, data analysis, understanding of data structures and relationships, proficiency in creating dashboards and reports, and the ability to interpret and communicate insights effectively.
Yes, Tableau courses are in demand as organizations across various industries recognize the value of data analysis and visualization. The ability to effectively use Tableau to analyze and present data is a sought-after skill in fields such as business intelligence, data analytics, data science, and data visualization. As data-driven decision-making continues to gain importance, the demand for Tableau skills is expected to remain high.
Tableau, a popular data visualization tool, offers various tools such as Tableau Desktop for creating interactive visualizations and dashboards, and Tableau Server for sharing and collaborating on visualizations across an organization.
Certified Visual Analytics Expert Training contributes to the field of business intelligence by empowering professionals to effectively analyze and visualize data, enabling organizations to gain actionable insights, improve decision-making, and drive strategic initiatives.
Tableau is a versatile data visualization tool that seamlessly connects and retrieves data from various sources, including databases of different complexities such as spreadsheets, Oracle, and cloud databases. It enables users to access and analyze data from a wide range of platforms, making it a powerful tool for data exploration and visualization.
The salary of a Tableau Developer in India ranges from INR 6,20,000 LPA according to a Glassdoor report.
Tableau helps businesses by providing powerful data visualization and analytics capabilities. It allows businesses to gain insights from their data, make data-driven decisions, identify trends, discover patterns, and communicate information effectively through intuitive and interactive visualizations. This enables organizations to improve operational efficiency, optimize strategies, identify opportunities, and solve complex business problems.
Tableau's rising popularity can be attributed to its ability to expedite data analysis and visualization through intuitive dashboards and worksheets. By leveraging Tableau, businesses can generate actionable insights, accelerate growth, and make informed decisions in a more efficient manner.
DataMites™ provide flexible learning options from traditional classroom training, lastest virtual live classroom to distance course. Based on your location preference, you may have one or more learning options
This course is perfectly aligned to the current industry requirements and gives exposure to all latest techniques and tools. The course curriculum is designed by specialists in this field and monitored improved by industry practitioners on continual basis.
All certificates can be validated with your unique certification number at IABAC.org portal. You also get candidate login at exam.iabac.org , where can find your test results and other relevant validation details.
The results of the Exam are immediate, if you take online test at exam.iabac.org portal. The certificate issuance, as per IABAC™ terms, takes about 7-10 bussiness days for e-certificate.
No, the exam fees are already included in the course fee and you will not be charged extra.
Course fee needs to be paid in one payment as it is required to block your seat for the entire course as well as book the certification exams with IABAC™. In case, if you have any specific constrains, your relation manager at DataMites™ shall assist you with part payment agreements
DataMites™ has a dedicated Placement Assistance Team(PAT), who work with candidates on individual basis in assisting for right Data Science job.
You get 100% refund training fee if you the training is not to your satisfaction but the exam fee will not be refunded as we pay to accreditation bodies. If the refund is due to your availability concerns, you may need to talk to the relationship manager and will be sorted out on case to case basis
DataMites™ provides loads of study materials, cheat sheets, data sets, videos so that you can learn and practice extensively. Along with study materials, you will get materials on job interviews, new letters with latest information on Data Science as well as job updates.
Certified Visual Analytics Expert Training refers to a specialized certification program that provides comprehensive training in the field of visual analytics, equipping individuals with the knowledge and skills to effectively analyze and present data visually for improved decision-making and business insights.
The purpose of a Certified Visual Analytics Expert Training program is to provide individuals with the skills and knowledge necessary to effectively analyze and interpret data through visualizations, enabling them to make informed decisions based on data insights.
Prerequisites for enrolling in a Certified Visual Analytics Expert Training program may vary, but a basic understanding of data analysis concepts, familiarity with spreadsheet software, and an interest in data visualization are beneficial.
The Certified Visual Analytics Expert Training offered by DataMites is a comprehensive program designed to provide expertise in visual analytics, covering various concepts, tools, and techniques.
The course duration is of 3 months and provides 1 year access to Elearning along with 5 capstone projects, 1 client project, internships, and job placement assistance.
Yes, DataMites provides study materials and resources for the training, which may include course materials, reference books, online resources, and access to relevant software tools.
Yes, practical exercises and projects are typically included in the Certified Visual Analytics Expert Training to provide hands-on experience and enhance practical skills in visual analytics along with unlimited access to data science cloud lab for practice.
The curriculum of the Certified Visual Analytics Expert Training covers a wide range of topics such as data visualization techniques, data exploration, dashboard development, storytelling with data, interactive visualization, Tableau Associate Syllabus and advanced analytics using visualization tools.
The training is conducted primarily online, allowing participants to access the course material and engage in learning activities remotely at their own convenience. DataMites also provides on-demand classroom training for students who are interested to take in-person knowledge.
Yes, live instructor-led sessions are often a part of the Certified Visual Analytics Expert Training program, providing opportunities for interactive learning, clarification of doubts, and real-time discussions.
The mode of Payment are-
DataMites often offers post-training support and career assistance to participants, which may include job placement assistance, resume building, interview preparation, and access to job portals.
The certified visual analytics expert training is accredited by IABAC, NASSCOM, and JAIN University.
Additional certifications or exams may be included in the training program, providing participants with the opportunity to earn industry-recognized certifications in visual analytics. After the completion of the course the aspirants receive certification from the international bodies called IABAC.
The teaching methodology used in the training combines a mix of theoretical concepts, practical demonstrations, hands-on exercises, real-world case studies, and interactive sessions to facilitate effective learning and skill development.
Datamites is the ideal choice for a certified Visual Analytics Expert training course due to their comprehensive curriculum, hands-on learning approach, experienced instructors, focus on industry projects, and proven track record of successful placements and positive reviews.
At DataMites, the course fee for the online Certified Visual Analytics Expert Training starts at an affordable price of INR 36,000, while the blended training option is available from INR 22,000. For those preferring classroom training, the course price starts at INR 45,000, providing flexibility to choose the most suitable learning mode based on individual preferences and budget.
The DataMites Placement Assistance Team(PAT) facilitates the aspirants in taking all the necessary steps in starting their career in Data Science. Some of the services provided by PAT are: -
The DataMites Placement Assistance Team(PAT) conducts sessions on career mentoring for the aspirants with a view of helping them realize the purpose they have to serve when they step into the corporate world. The students are guided by industry experts about the various possibilities in the Data Science career, this will help the aspirants to draw a clear picture of the career options available. Also, they will be made knowledgeable about the various obstacles they are likely to face as a fresher in the field, and how they can tackle.
No, PAT does not promise a job, but it helps the aspirants to build the required potential needed in landing a career. The aspirants can capitalize on the acquired skills, in the long run, to a successful career in Data Science.