Instructor Led Live Online
Self Learning + Live Mentoring
In - Person Classroom Training


In the business intelligence sector, Tableau has made a name for itself as a powerful and rapidly expanding data visualization solution.
A spreadsheet tool called Excel is useful for performing various calculations, statistical procedures, and data analysis. With the help of the business intelligence platform Tableau, you can execute online analytical processing and analytics as well as queries, reports, and other tasks.
Tableau is a visual platform for business intelligence and analytics that allows users to view, assess, comprehend, and make decisions on a range of data. You can create any type of graph, plot, or chart using this method without utilizing programming.
Tableau was established in 2003 by Pat Hanrahan, Chris Stolte, and Christian Chabot of Stanford University.
Tableau is getting more and more popular as a result of its ability to produce dashboards and worksheets that allow for faster data analysis and visualization. We can design dashboards with Tableau that offer useful insights and aid in our business's speedy expansion.
With the aid of data visualization tools that are available to users from any sector and background, Tableau enables organizations to make decisions. By giving them the ability to visualize their data in novel ways, it helps organizations keep up with the quickly evolving state of technology and outperform their rivals.
Tableau distinguishes itself from other self-service BI packages with its high-quality data visualizations and self-service analyses. Connecting to a variety of data sources is a breeze using Tableau. It can be connected to more than 40 different sources. As a result, you can incorporate stunning graphics and Excel spreadsheets.
Tableau is a fully equipped data analytics tool for acquiring, analyzing, sharing, and collaborating on insights from large data sets. Tableau, the industry leader in self-service visual analysis, enables users to explore novel concepts with managed big data and quickly share their findings throughout the organization.
By assisting analytics teams in better understanding and presenting data, Tableau helps them to develop their collective data scientist skill sets. It's also fantastic for swiftly assembling reports when they're required—without having to manually develop graphics. With the help of Tableau, analytics teams can delve deeply into data, uncover hidden insights, and present the findings in a way that tells a visually appealing story. Tableau is the best tool for quickly analyzing, slicing, and presenting data in an interactive, collaborative, and visually appealing manner.
Software called Tableau for business intelligence (BI) and data visualization is developing quickly. It is easy to understand, easy to use, and easy to install. This program will walk you through learning Tableau step-by-step. Beginners are strongly urged to follow this advice.
One of the most sought-after products in today's cutthroat IT industry is Tableau, a tool for data visualization. It is not unexpected that there is a huge need for Tableau developers given how data-driven the world is becoming. Surprisingly, even small enterprises are prepared to offer eligible applicants a competitive wage. Data visualization and business intelligence have been identified by Gartner as two of the top technologies for the eighth year in a row.
The nice part of learning Tableau is that you can learn it quickly even if you don't have a technical background. Although no coding experience is required, I recommend that you have a basic understanding of SQL. Tableau Desktop requires very little hardware.
Tableau is known for its data visualization capabilities, but Power BI provides a large number of data points for data visualization. Tableau BI can handle a huge volume of data faster than Power BI, but it can only handle a modest amount of data.
Learning tableau is beneficial. Learning how to utilize Tableau, a widely used data visualization application used by a variety of industries, will help you stand out when applying for data-related jobs.
Depending on the level of training you need, Tableau Course Training costs can vary in Bangalore. However, the cost of your Tableau classroom training can vary from INR 20,000 to INR 40,000 depending on the training company you pick.
The best thing about Tableau is that no prior knowledge is necessary. without having any prior technical or coding expertise.
As per Indeed.com, the national average salary for a Tableau Developer in Bangalore is INR 8,57,195 per year.
The Tableau Course Fee worldwide shall be anywhere from:
Tableau is anticipated to rank among the most popular business intelligence trends in 2022. As the data visualization tool develops in popularity in both large and small enterprises, there is a significant demand for Tableau positions.
Exploring, experimenting, fixing, preparing, and presenting data is made easy, quick, and beautiful with Tableau. Top Tableau Certifications in Bangalore include the following:
Tableau Certified Associates are experts at using Tableau's tools for data analysis and problem-solving. They can apply their understanding of maps, gathering data, and maths to more intricate data analysis. DataMites provides complete training from the best instructors in the industry at affordable rates to become a Tableau Certified Associate.
A foundation in visual analytics, hands-on experience, and an understanding of the key Tableau capabilities are all included in the entry-level DataMites Tableau Associate course. DataMites provides affordable Tableau Certified Associate Training in Bangalore from subject-matter specialists.
DataMites Tableau Associate is a beginner-level training that combines hands-on practice with fundamental knowledge of visual analytics and major Tableau capabilities. You may become a Tableau Associate by attending DataMites Tableau Associate training in Bangalore, which is led by industry specialists.
A tableau specialist is a skilled user of the software used for data visualization and business intelligence.
There will be a three-month Tableau Certification Training program in Bangalore. Training sessions are held on weekdays and weekends. Depending on your availability, you can choose any choice.
Knowledge of Tableau Desktop is combined with real-world experience in the professional training program DataMites Tableau Expert. At DataMites, we offer thorough Tableau Expert Training in Bangalore led by business experts at a reasonable cost.
The cost of the Tableau course in Bangalore will be between Rs. 10,148 to Rs. 36,000. Depending on the training program and delivery method you select, the cost of Tableau certification in Bangalore may change.
Certified Visual Analytics Expert - 36,000 INR
Discounted Price - 18,348 INR
Tableau Associate - 21,000 INR
Discounted Price - 10,148 INR
Tableau Expert - 36,000 INR
Discounted Price - 18,348 INR
In the Indian cities of Bangalore, Chennai, Pune, and Hyderabad, you may enroll in offline Tableau classes through DataMites. In other instances, we are pleased to provide the students with Classroom training for Tableau ON-DEMAND.
We are adamant about giving you access to certified, highly trained trainers that have years of expertise in the field and are knowledgeable about the material.
With our Flexi-Pass for Tableau Certification Training in Bangalore, you get three months to attend Datamites sessions pertaining to any question or revision you want to pass.
You will receive an IABAC® certification from us, which guarantees widespread acknowledgment of your pertinent skills.
Yes. Photo IDs with photographs, such as a national ID card, a driver's license, etc., are required in order to schedule the certification exam as needed and to provide the participation certificate.
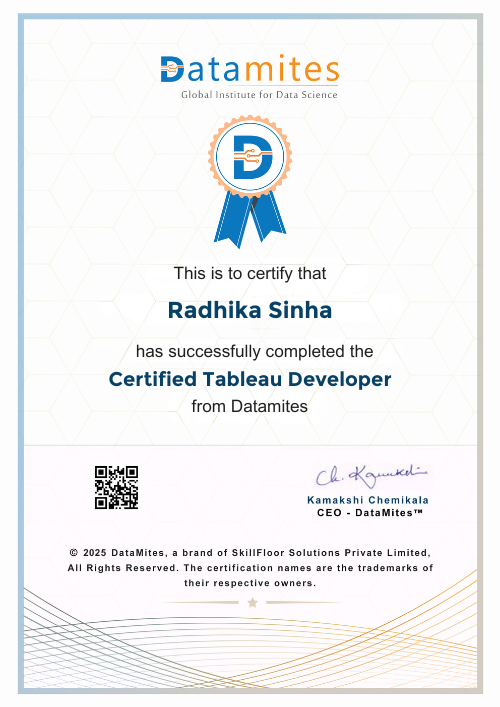
You will receive a Tableau Course Completion Certificate once your course is over, of course.
Simply talk to your teachers about scheduling a lesson that works with your schedule. Each session of the Online Tableau Training in Bangalore will be filmed and published, allowing you to easily catch up on the material you missed at your own pace and convenience.
Yes, you will be given a complimentary demo class to provide you with a quick overview of the training's procedures and contents.
DataMites employs the method of learning through a case study approach to deliver both theoretical comprehension and practical information. Being particular it includes Case studies, projects, practical training, model implementation, and theory.
It is absolutely essential that you make the most of your training sessions. Naturally, you can ask for a support session if you need further clarification.
The DataMites Placement Assistance Team(PAT) facilitates the aspirants in taking all the necessary steps in starting their career in Data Science. Some of the services provided by PAT are: -
The DataMites Placement Assistance Team(PAT) conducts sessions on career mentoring for the aspirants with a view of helping them realize the purpose they have to serve when they step into the corporate world. The students are guided by industry experts about the various possibilities in the Data Science career, this will help the aspirants to draw a clear picture of the career options available. Also, they will be made knowledgeable about the various obstacles they are likely to face as a fresher in the field, and how they can tackle.
No, PAT does not promise a job, but it helps the aspirants to build the required potential needed in landing a career. The aspirants can capitalize on the acquired skills, in the long run, to a successful career in Data Science.


