4.9 (16,300) reviews
 110,000
64,191*
NO COST EMI : 10,699 p.m for 6 Months
*Offer valid till 2nd August 2026
Instructor Led Live Online
Self Learning + Live Mentoring
In - Person Classroom Training


MODULE 1: DATA ANALYSIS FOUNDATION
• Data Analysis Introduction
• Data Preparation for Analysis
• Common Data Problems
• Various Tools for Data Analysis
• Evolution of Analytics domain
MODULE 2: CLASSIFICATION OF ANALYTICS
• Four types of the Analytics
• Descriptive Analytics
• Diagnostics Analytics
• Predictive Analytics
• Prescriptive Analytics
• Human Input in Various type of Analytics
MODULE 3: CRIP-DM Model
• Introduction to CRIP-DM Model
• Business Understanding
• Data Understanding
• Data Preparation
• Modeling, Evaluation, Deploying,Monitoring
MODULE 4: UNIVARIATE DATA ANALYSIS
• Summary statistics -Determines the value’s center and spread.
• Measure of Central Tendencies: Mean, Median and Mode
• Measures of Variability: Range, Interquartile range, Variance and Standard Deviation
• Frequency table -This shows how frequently various values occur.
• Charts -A visual representation of the distribution of values.
MODULE 5: DATA ANALYSIS WITH VISUAL CHARTS
• Line Chart
• Column/Bar Chart
• Waterfall Chart
• Tree Map Chart
• Box Plot
MODULE 6: BI-VARIATE DATA ANALYSIS
• Scatter Plots
• Regression Analysis
• Correlation Coefficients
MODULE 1: PYTHON BASICS
• Introduction of python
• Installation of Python and IDE
• Python Variables
• Python basic data types
• Number & Booleans, strings
• Arithmetic Operators
• Comparison Operators
• Assignment Operators
MODULE 2: PYTHON CONTROL STATEMENTS
• IF Conditional statement
• IF-ELSE
• NESTED IF
• Python Loops basics
• WHILE Statement
• FOR statements
• BREAK and CONTINUE statements
MODULE 3: PYTHON DATA STRUCTURES
• Basic data structure in python
• Basics of List
• List: Object, methods
• Tuple: Object, methods
• Sets: Object, methods
• Dictionary: Object, methods
MODULE 4: PYTHON FUNCTIONS
• Functions basics
• Function Parameter passing
• Lambda functions
• Map, reduce, filter functions
MODULE 1 : OVERVIEW OF STATISTICS
MODULE 2 : HARNESSING DATA
MODULE 3 : EXPLORATORY DATA ANALYSIS
MODULE 4 : HYPOTHESIS TESTING
MODULE 1: COMPARISION AND CORRELATION ANALYSIS
• Data comparison Introduction,
• Performing Comparison Analysis on Data
• Concept of Correlation
• Calculating Correlation with Excel
• Comparison vs Correlation
• Hands-on case study : Comparison Analysis
• Hands-on case study Correlation Analysis
MODULE 2: VARIANCE AND FREQUENCY ANALYSIS
• Variance Analysis Introduction
• Data Preparation for Variance Analysis
• Performing Variance and Frequency Analysis
• Business use cases for Variance Analysis
• Business use cases for Frequency Analysis
MODULE 3: RANKING ANALYSIS
• Introduction to Ranking Analysis
• Data Preparation for Ranking Analysis
• Performing Ranking Analysis with Excel
• Insights for Ranking Analysis
• Hands-on Case Study: Ranking Analysis
MODULE 4: BREAK EVEN ANALYSIS
• Concept of Breakeven Analysis
• Make or Buy Decision with Break Even
• Preparing Data for Breakeven Analysis
• Hands-on Case Study: Manufacturing
MODULE 5: PARETO (80/20 RULE) ANALSYSIS
• Pareto rule Introduction
• Preparation Data for Pareto Analysis,
• Performing Pareto Analysis on Data
• Insights on Optimizing Operations with Pareto Analysis
• Hands-on case study: Pareto Analysis
MODULE 6: Time Series and Trend Analysis
• Introduction to Time Series Data
• Preparing data for Time Series Analysis
• Types of Trends
• Trend Analysis of the Data with Excel
• Insights from Trend Analysis
MODULE 7: DATA ANALYSIS BUSINESS REPORTING
• Management Information System Introduction
• Various Data Reporting formats
• Creating Data Analysis reports as per the requirements
MODULE 1: DATA ANALYTICS FOUNDATION
• Business Analytics Overview
• Application of Business Analytics
• Benefits of Business Analytics
• Challenges
• Data Sources
• Data Reliability and Validity
MODULE 2: OPTIMIZATION MODELS
• Predictive Analytics with Low Uncertainty;Case Study
• Mathematical Modeling and Decision Modeling
• Product Pricing with Prescriptive Modeling
• Assignment 1 : KERC Inc, Optimum Manufacturing Quantity
MODULE 3: PREDICTIVE ANALYTICS WITH REGRESSION
• Mathematics behind Linear Regression
• Case Study : Sales Promotion Decision with Regression Analysis
• Hands on Regression Modeling in Excel
MODULE 4: DECISION MODELING
• Predictive Analytics with High Uncertainty
• Case Study-Monte Carlo Simulation
• Comparing Decisions in Uncertain Settings
• Trees for Decision Modeling
• Case Study : Supplier Decision Modeling - Kickathlon Sports Retailer
MODULE 1: MACHINE LEARNING INTRODUCTION
• What Is ML? ML Vs AI
• ML Workflow, Popular ML Algorithms
• Clustering, Classification And Regression
• Supervised Vs Unsupervised
MODULE 2: ML ALGO: LINEAR REGRESSSION
• Introduction to Linear Regression
• How it works: Regression and Best Fit Line
• Hands-on Linear Regression with ML Tool
MODULE 3: ML ALGO: LOGISTIC REGRESSION
• Introduction to Logistic Regression;
• Classification & Sigmoid Curve
• Hands-on Logistics Regression with ML Tool
MODULE 4: ML ALGO: KNN
• Introduction to KNN; Nearest Neighbor
• Regression with KNN
• Hands-on: KNN with ML Tool
MODULE 5: ML ALGO: K MEANS CLUSTERING
• Understanding Clustering (Unsupervised)
• Introduction to KMeans and How it works
• Hands-on: K Means Clustering
MODULE 6: ML ALGO: DECISION TREE
• Decision Tree and How it works
• Hands-on: Decision Tree with ML Tool
MODULE 7: ML ALGO: SUPPORT VECTOR MACHINE (SVM)
• Introduction to SVM
• How It Works: SVM Concept, Kernel Trick
• Hands-on: SVM with ML Tool
MODULE 8: ARTIFICIAL NEURAL NETWORK (ANN)
• Introduction to ANN, How It Works
• Back propagation, Gradient Descent
• Hands-on: ANN with ML Tool
MODULE 1: DATABASE INTRODUCTION
• DATABASE Overview
• Key concepts of database management
• CRUD Operations
• Relational Database Management System
• RDBMS vs No-SQL (Document DB)
MODULE 2: SQL BASICS
• Introduction to Databases
• Introduction to SQL
• SQL Commands
• MY SQL workbench installation
MODULE 3: DATA TYPES AND CONSTRAINTS
• Numeric, Character, date time data type
• Primary key, Foreign key, Not null
• Unique, Check, default, Auto increment
MODULE 4: DATABASES AND TABLES (MySQL)
• Create database
• Delete database
• Show and use databases
• Create table, Rename table
• Delete table, Delete table records
• Create new table from existing data types
• Insert into, Update records
• Alter table
MODULE 5: SQL JOINS
• Inner join, Outer Join
• Left join, Right Join
• Self Join, Cross join
• Windows Functions: Over, Partition, Rank
MODULE 6: SQL COMMANDS AND CLAUSES
• Select, Select distinct
• Aliases, Where clause
• Relational operators, Logical
• Between, Order by, In
• Like, Limit, null/not null, group by
• Having, Sub queries
MODULE 7: DOCUMENT DB/NO-SQL DB
• Introduction of Document DB
• Document DB vs SQL DB
• Popular Document DBs
• MongoDB basics
• Data format and Key methods
• MongoDB data management
MODULE 1: BIG DATA INTRODUCTION
• Big Data Overview
• Five Vs of Big Data
• What is Big Data and Hadoop
• Introduction to Hadoop
• Components of Hadoop Ecosystem
• Big Data Analytics Introduction
MODULE 2: HDFS AND MAP REDUCE
• HDFS – Big Data Storage
• Distributed Processing with Map Reduce
• Mapping and reducing stages concepts
• Key Terms: Output Format, Partitioners, Combiners, Shuffle, and Sort
MODULE 3: PYSPARK FOUNDATION
• PySpark Introduction
• Spark Configuration
• Resilient distributed datasets (RDD)
• Working with RDDs in PySpark
• Aggregating Data with Pair RDDs
MODULE 4: SPARK SQL and HADOOP HIVE
• Introducing Spark SQL
• Spark SQL vs Hadoop Hive
MODULE 1: TABLEAU FUNDAMENTALS
• Introduction to Business Intelligence & Introduction to Tableau
• Interface Tour, Data visualization: Pie chart, Column chart, Bar chart.
• Bar chart, Tree Map, Line Chart
• Area chart, Combination Charts, Map
• Dashboards creation, Quick Filters
• Create Table Calculations
• Create Calculated Fields
• Create Custom Hierarchies
MODULE 2: POWER-BI BASICS
• Power BI Introduction
• Basics Visualizations
• Dashboard Creation
• Basic Data Cleaning
• Basic DAX FUNCTION
MODULE 3: DATA TRANSFORMATION TECHNIQUES
• Exploring Query Editor
• Data Cleansing and Manipulation:
• Creating Our Initial Project File
• Connecting to Our Data Source
• Editing Rows
• Changing Data Types
• Replacing Values
MODULE 4: CONNECTING TO VARIOUS DATA SOURCES
• Connecting to a CSV File
• Connecting to a Webpage
• Extracting Characters
• Splitting and Merging Columns
• Creating Conditional Columns
• Creating Columns from Examples
• Create Data Model
AI is the future, and DataMites helped me step into it! The online Data Science course was easy to follow, and the tutors explained everything clearly. Even after completing my course, the team supported me with placements and I successfully cracked a job! Grateful to DataMites for shaping my career.
I joined DataMites to learn Data Science and gained strong skills in ML, DL, and Statistics. Through my internship at Rubixe AI Solutions, I worked on real-world projects, which helped me land job interviews and an offer. The trainers were very supportive and explained every concept clearly. Thanks to DataMites, my data science journey was smooth and successful.
My mentor, a DataMites alumnus, suggested I join the Data Science course, and it was one of my best decisions! The offline classes were interactive and full of guidance, and I got the chance to intern at Rubixe AI Solutions. The placement team was very supportive and helped me perfect my resume. Truly thankful to DataMites for this amazing learning journey.
I joined DataMites after completing my engineering in Computer Science and became a Certified Data Scientist. With their support, I completed an internship at Rubix AI Solutions and now work as an AI intern at Inventor Hub. DataMites made learning statistics and data science easy with clear guidance and great materials. I’m truly thankful for their support.
I joined DataMites for the Certified Data Scientist online course, and it was a great experience! The real-time projects helped me apply my learning practically, and the placement support added real value to my career restart after 8 years. DataMites is the perfect platform to learn, grow, and begin your data science journey.
I joined DataMites for the Data Science course and learned Python, SQL, Machine Learning, and Deep Learning through hands-on projects. The trainers are excellent at explaining concepts clearly. The placement team is very supportive and provides great opportunities thanks to DataMites for helping me start my data science journey.
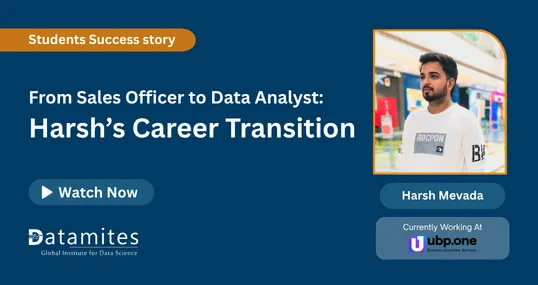
I joined DataMites after my B.Tech when I developed an interest in Data Science and Machine Learning. The training was well-structured, and I even got an internship opportunity that helped me gain real experience. The placement team was super supportive and guided me through every step. Thanks to DataMites, I’m now placed at Horizon Broadband Pvt. Ltd.
I joined DataMites after completing my BCA, and it was the best decision for my data science career! I learned Python, SQL, Machine Learning, Deep Learning, and NLP, and worked on several capstone and client projects that gave me real-world experience. The trainers and team were always friendly and supportive, patiently clearing all my doubts. Thanks to DataMites, I’m confident and job-ready in data science
I started my data science journey with DataMites, and it’s been an amazing experience! The Certified Data Scientist Program helped me learn everything from scratch through hands-on projects and an internship. The placement team was incredibly supportive, always ready to clarify my doubts. Thanks to their guidance, I successfully got placed. Highly recommend DataMites to anyone starting their data science career
Enrolling at DataMites was one of the best decisions I made for my career. Coming from a freelance writing background with no prior technical experience, I was initially unsure about stepping into the field of data analytics. But DataMites made the transition smooth and achievable. I’d highly recommend them to anyone looking for a guided, industry-ready data analytics course. A true DataMites success story!
Data Analytics involves the process of gathering, organizing, analyzing, and interpreting large amounts of data to discover meaningful patterns, insights, and trends that support informed decision-making.
Data Analytics is utilized by various industries, including finance, healthcare, retail, e-commerce, marketing, telecommunications, and manufacturing, to enhance operations and make data-driven decisions.
The scope of data analytics is extensive and continually expanding due to the increasing availability of data and technological advancements. This creates a demand for professionals capable of extracting valuable insights from data and driving business growth.
Data Analytics offers a wide range of career opportunities, including data analytics job roles such as Data Analyst, Data Scientist, Business Analyst, Data Engineer, and Data Architect. These roles provide room for growth, specialization, and leadership positions.
The average global salary for a Data Analyst varies depending on location. For instance, in the UK, it averages around £36,535 per year, while in Canada, it is approximately C$58,843 per year. In the United States, the average is USD 69,517 per year.
In Kohima, India, a Data Analyst can earn an average annual salary of around ₹3,44,780.
DataMites is highly regarded as a top institute for data analytics training. We offer comprehensive courses and training programs at multiple locations, providing learners with the necessary knowledge and practical skills to succeed in the field.
The "Certified Data Analyst" course offered by DataMites is widely regarded as an excellent option for those interested in pursuing a career in data analytics. This comprehensive course covers data analysis techniques, statistical analysis, data visualization, and machine learning, equipping learners with essential skills for effective data handling and valuable insights extraction.
The cost of a Data Analytics Course can vary depending on factors such as the chosen institute, course duration, curriculum, and additional features. Typically, data analytics training in Kohima ranges from 40,000 to 80,000 INR.
While coding skills can be beneficial for Data Analysts, they are not always mandatory. Proficiency in programming languages such as Python, R, SQL, or tools like Excel and Tableau can enhance a data analyst's capabilities and job prospects. However, the level of coding required may vary based on the specific role and industry.
The monthly salary of an entry-level Data Analyst in India can vary based on location, company size, industry, and skills. On average, a fresh Data Analyst in India can expect a monthly salary of around ₹13,300 or an annual salary of approximately ₹1.6 Lakhs. (Ambitionbox)
Data Analysts face certain challenges in their role, as it requires a combination of analytical skills, problem-solving abilities, domain knowledge, and proficiency in data analysis techniques and tools. However, with proper training, continuous learning, and practical experience, these challenges can be overcome, leading to success in the field.
Yes, Data Analytics is a promising career option for freshers. It offers excellent job prospects, competitive salaries, and opportunities for growth. The increasing reliance on data-driven decision-making in various industries suggests a continued demand for skilled data analysts.
Graduation is not always a mandatory requirement for becoming a data analyst. However, having a bachelor's degree in fields such as computer science, statistics, mathematics, engineering, or business can be advantageous and increase job opportunities. Additionally, relevant certifications, practical experience, and strong analytical skills are highly valued in the field.
While it may be challenging to secure a data analyst job without any prior experience, it is not entirely impossible. Entry-level positions or internships may be available for individuals with relevant educational qualifications, certifications, and a strong understanding of data analytics concepts. Showcasing practical projects, participating in online competitions, and continuously developing skills can improve the chances of getting hired as a data analyst with limited or no experience.
DataMites is the top choice for Data Analytics Courses in Kohima due to its comprehensive and industry-relevant curriculum, experienced trainers, and practical learning approach. They offer flexible training options, including both classroom and online modes, allowing learners to gain hands-on experience through real-world projects.
DataMites provides Certified Data Analyst Training in Kohima with a strong emphasis on practical application and industry-oriented skills. Their trainers are seasoned professionals with extensive experience, ensuring a high-quality learning experience. Additionally, successful completion of the course leads to globally recognized certifications, enhancing career prospects.
While the specific prerequisites for data analytics training at DataMites in Kohima may vary depending on the course, having a basic understanding of mathematics, statistics, and computer usage is generally beneficial.
The DataMites Certified Data Analyst Course in Kohima is open to aspiring data analysts, professionals seeking to upskill in data analytics, graduates, and anyone interested in data analysis.
The fee for the Data Analytics Course in Kohima at DataMites varies based on factors such as the course duration, delivery method, and additional offerings. Typically, the cost for the certified data analyst training in Kohima ranges between INR 28,178 and INR 76,000, providing options to suit individual preferences and requirements.
The Flexi-Pass offered by DataMites allows learners to access multiple courses at a discounted price, offering flexibility in choosing and attending different courses based on individual learning needs and preferences.
The DataMites Certified Data Analytics Course in Kohima spans over 6 months, comprising more than 200 hours of learning. This well-structured course allows ample time for hands-on practical exercises and projects, enabling learners to acquire practical skills and valuable experience in the data analytics field.
The DataMites Certified Data Analyst Training in Kohima covers a wide range of topics, including data analysis techniques, statistical analysis, data visualization, machine learning, and more.
DataMites accepts various payment methods, including online payment gateways, bank transfers, and other convenient modes of payment. For specific details, it is best to inquire directly with DataMites.
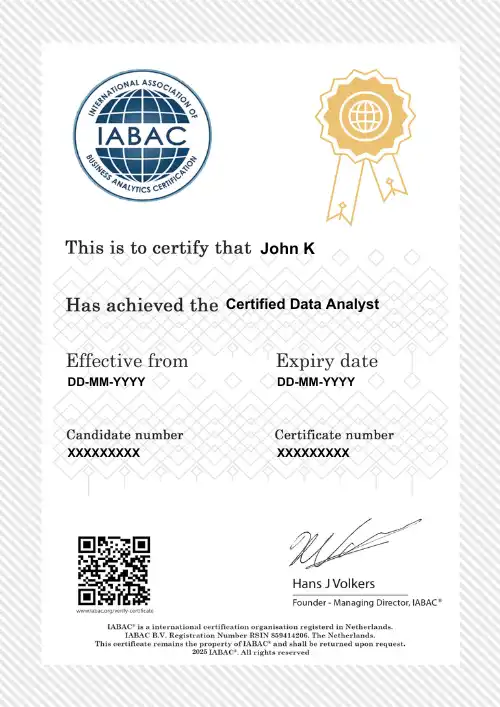
Yes, upon successful completion of the Data Analytics training at DataMites, you will receive prestigious certifications from IABAC, NASSCOM FutureSkills Prime, and JainX. These globally recognized certifications can significantly enhance your career prospects and demonstrate your expertise in data analytics to potential employers.
Yes, DataMites offers data analytics classroom training in Kohima based on demand. Their interactive and instructor-led sessions create a traditional classroom environment where learners can actively engage and benefit from the instructors' expertise. This approach ensures effective learning and enables participants to apply the concepts in real-time scenarios.
DataMites provides various training options for data analytics, including data analytics classroom training in Kohima, data analytics training online, corporate training, and self-paced learning. These options cater to different learning preferences and requirements.
DataMites may offer trial classes or demo sessions for prospective learners to experience their teaching methodology and course content before making the fee payment.
DataMites has a team of experienced trainers specializing in data analytics. These trainers possess industry experience and expertise in the field of data analytics.
The DataMites Placement Assistance Team(PAT) facilitates the aspirants in taking all the necessary steps in starting their career in Data Science. Some of the services provided by PAT are: -
The DataMites Placement Assistance Team(PAT) conducts sessions on career mentoring for the aspirants with a view of helping them realize the purpose they have to serve when they step into the corporate world. The students are guided by industry experts about the various possibilities in the Data Science career, this will help the aspirants to draw a clear picture of the career options available. Also, they will be made knowledgeable about the various obstacles they are likely to face as a fresher in the field, and how they can tackle.
No, PAT does not promise a job, but it helps the aspirants to build the required potential needed in landing a career. The aspirants can capitalize on the acquired skills, in the long run, to a successful career in Data Science.