110,000
55,451*
NO COST EMI : 9,242 p.m for 6 Months
*Offer valid till 5th April 2026
Instructor Led Live Online
Self Learning + Live Mentoring
In - Person Classroom Training


MODULE 1: DATA ANALYSIS FOUNDATION
• Data Analysis Introduction
• Data Preparation for Analysis
• Common Data Problems
• Various Tools for Data Analysis
• Evolution of Analytics domain
MODULE 2: CLASSIFICATION OF ANALYTICS
• Four types of the Analytics
• Descriptive Analytics
• Diagnostics Analytics
• Predictive Analytics
• Prescriptive Analytics
• Human Input in Various type of Analytics
MODULE 3: CRIP-DM Model
• Introduction to CRIP-DM Model
• Business Understanding
• Data Understanding
• Data Preparation
• Modeling, Evaluation, Deploying,Monitoring
MODULE 4: UNIVARIATE DATA ANALYSIS
• Summary statistics -Determines the value’s center and spread.
• Measure of Central Tendencies: Mean, Median and Mode
• Measures of Variability: Range, Interquartile range, Variance and Standard Deviation
• Frequency table -This shows how frequently various values occur.
• Charts -A visual representation of the distribution of values.
MODULE 5: DATA ANALYSIS WITH VISUAL CHARTS
• Line Chart
• Column/Bar Chart
• Waterfall Chart
• Tree Map Chart
• Box Plot
MODULE 6: BI-VARIATE DATA ANALYSIS
• Scatter Plots
• Regression Analysis
• Correlation Coefficients
MODULE 1: PYTHON BASICS
• Introduction of python
• Installation of Python and IDE
• Python Variables
• Python basic data types
• Number & Booleans, strings
• Arithmetic Operators
• Comparison Operators
• Assignment Operators
MODULE 2: PYTHON CONTROL STATEMENTS
• IF Conditional statement
• IF-ELSE
• NESTED IF
• Python Loops basics
• WHILE Statement
• FOR statements
• BREAK and CONTINUE statements
MODULE 3: PYTHON DATA STRUCTURES
• Basic data structure in python
• Basics of List
• List: Object, methods
• Tuple: Object, methods
• Sets: Object, methods
• Dictionary: Object, methods
MODULE 4: PYTHON FUNCTIONS
• Functions basics
• Function Parameter passing
• Lambda functions
• Map, reduce, filter functions
MODULE 1 : OVERVIEW OF STATISTICS
MODULE 2 : HARNESSING DATA
MODULE 3 : EXPLORATORY DATA ANALYSIS
MODULE 4 : HYPOTHESIS TESTING
MODULE 1: COMPARISION AND CORRELATION ANALYSIS
• Data comparison Introduction,
• Performing Comparison Analysis on Data
• Concept of Correlation
• Calculating Correlation with Excel
• Comparison vs Correlation
• Hands-on case study : Comparison Analysis
• Hands-on case study Correlation Analysis
MODULE 2: VARIANCE AND FREQUENCY ANALYSIS
• Variance Analysis Introduction
• Data Preparation for Variance Analysis
• Performing Variance and Frequency Analysis
• Business use cases for Variance Analysis
• Business use cases for Frequency Analysis
MODULE 3: RANKING ANALYSIS
• Introduction to Ranking Analysis
• Data Preparation for Ranking Analysis
• Performing Ranking Analysis with Excel
• Insights for Ranking Analysis
• Hands-on Case Study: Ranking Analysis
MODULE 4: BREAK EVEN ANALYSIS
• Concept of Breakeven Analysis
• Make or Buy Decision with Break Even
• Preparing Data for Breakeven Analysis
• Hands-on Case Study: Manufacturing
MODULE 5: PARETO (80/20 RULE) ANALSYSIS
• Pareto rule Introduction
• Preparation Data for Pareto Analysis,
• Performing Pareto Analysis on Data
• Insights on Optimizing Operations with Pareto Analysis
• Hands-on case study: Pareto Analysis
MODULE 6: Time Series and Trend Analysis
• Introduction to Time Series Data
• Preparing data for Time Series Analysis
• Types of Trends
• Trend Analysis of the Data with Excel
• Insights from Trend Analysis
MODULE 7: DATA ANALYSIS BUSINESS REPORTING
• Management Information System Introduction
• Various Data Reporting formats
• Creating Data Analysis reports as per the requirements
MODULE 1: DATA ANALYTICS FOUNDATION
• Business Analytics Overview
• Application of Business Analytics
• Benefits of Business Analytics
• Challenges
• Data Sources
• Data Reliability and Validity
MODULE 2: OPTIMIZATION MODELS
• Predictive Analytics with Low Uncertainty;Case Study
• Mathematical Modeling and Decision Modeling
• Product Pricing with Prescriptive Modeling
• Assignment 1 : KERC Inc, Optimum Manufacturing Quantity
MODULE 3: PREDICTIVE ANALYTICS WITH REGRESSION
• Mathematics behind Linear Regression
• Case Study : Sales Promotion Decision with Regression Analysis
• Hands on Regression Modeling in Excel
MODULE 4: DECISION MODELING
• Predictive Analytics with High Uncertainty
• Case Study-Monte Carlo Simulation
• Comparing Decisions in Uncertain Settings
• Trees for Decision Modeling
• Case Study : Supplier Decision Modeling - Kickathlon Sports Retailer
MODULE 1: MACHINE LEARNING INTRODUCTION
• What Is ML? ML Vs AI
• ML Workflow, Popular ML Algorithms
• Clustering, Classification And Regression
• Supervised Vs Unsupervised
MODULE 2: ML ALGO: LINEAR REGRESSSION
• Introduction to Linear Regression
• How it works: Regression and Best Fit Line
• Hands-on Linear Regression with ML Tool
MODULE 3: ML ALGO: LOGISTIC REGRESSION
• Introduction to Logistic Regression;
• Classification & Sigmoid Curve
• Hands-on Logistics Regression with ML Tool
MODULE 4: ML ALGO: KNN
• Introduction to KNN; Nearest Neighbor
• Regression with KNN
• Hands-on: KNN with ML Tool
MODULE 5: ML ALGO: K MEANS CLUSTERING
• Understanding Clustering (Unsupervised)
• Introduction to KMeans and How it works
• Hands-on: K Means Clustering
MODULE 6: ML ALGO: DECISION TREE
• Decision Tree and How it works
• Hands-on: Decision Tree with ML Tool
MODULE 7: ML ALGO: SUPPORT VECTOR MACHINE (SVM)
• Introduction to SVM
• How It Works: SVM Concept, Kernel Trick
• Hands-on: SVM with ML Tool
MODULE 8: ARTIFICIAL NEURAL NETWORK (ANN)
• Introduction to ANN, How It Works
• Back propagation, Gradient Descent
• Hands-on: ANN with ML Tool
MODULE 1: DATABASE INTRODUCTION
• DATABASE Overview
• Key concepts of database management
• CRUD Operations
• Relational Database Management System
• RDBMS vs No-SQL (Document DB)
MODULE 2: SQL BASICS
• Introduction to Databases
• Introduction to SQL
• SQL Commands
• MY SQL workbench installation
MODULE 3: DATA TYPES AND CONSTRAINTS
• Numeric, Character, date time data type
• Primary key, Foreign key, Not null
• Unique, Check, default, Auto increment
MODULE 4: DATABASES AND TABLES (MySQL)
• Create database
• Delete database
• Show and use databases
• Create table, Rename table
• Delete table, Delete table records
• Create new table from existing data types
• Insert into, Update records
• Alter table
MODULE 5: SQL JOINS
• Inner join, Outer Join
• Left join, Right Join
• Self Join, Cross join
• Windows Functions: Over, Partition, Rank
MODULE 6: SQL COMMANDS AND CLAUSES
• Select, Select distinct
• Aliases, Where clause
• Relational operators, Logical
• Between, Order by, In
• Like, Limit, null/not null, group by
• Having, Sub queries
MODULE 7: DOCUMENT DB/NO-SQL DB
• Introduction of Document DB
• Document DB vs SQL DB
• Popular Document DBs
• MongoDB basics
• Data format and Key methods
• MongoDB data management
MODULE 1: BIG DATA INTRODUCTION
• Big Data Overview
• Five Vs of Big Data
• What is Big Data and Hadoop
• Introduction to Hadoop
• Components of Hadoop Ecosystem
• Big Data Analytics Introduction
MODULE 2: HDFS AND MAP REDUCE
• HDFS – Big Data Storage
• Distributed Processing with Map Reduce
• Mapping and reducing stages concepts
• Key Terms: Output Format, Partitioners, Combiners, Shuffle, and Sort
MODULE 3: PYSPARK FOUNDATION
• PySpark Introduction
• Spark Configuration
• Resilient distributed datasets (RDD)
• Working with RDDs in PySpark
• Aggregating Data with Pair RDDs
MODULE 4: SPARK SQL and HADOOP HIVE
• Introducing Spark SQL
• Spark SQL vs Hadoop Hive
MODULE 1: TABLEAU FUNDAMENTALS
• Introduction to Business Intelligence & Introduction to Tableau
• Interface Tour, Data visualization: Pie chart, Column chart, Bar chart.
• Bar chart, Tree Map, Line Chart
• Area chart, Combination Charts, Map
• Dashboards creation, Quick Filters
• Create Table Calculations
• Create Calculated Fields
• Create Custom Hierarchies
MODULE 2: POWER-BI BASICS
• Power BI Introduction
• Basics Visualizations
• Dashboard Creation
• Basic Data Cleaning
• Basic DAX FUNCTION
MODULE 3: DATA TRANSFORMATION TECHNIQUES
• Exploring Query Editor
• Data Cleansing and Manipulation:
• Creating Our Initial Project File
• Connecting to Our Data Source
• Editing Rows
• Changing Data Types
• Replacing Values
MODULE 4: CONNECTING TO VARIOUS DATA SOURCES
• Connecting to a CSV File
• Connecting to a Webpage
• Extracting Characters
• Splitting and Merging Columns
• Creating Conditional Columns
• Creating Columns from Examples
• Create Data Model
I joined DataMites for the Certified Data Scientist online course, and it was a great experience! The real-time projects helped me apply my learning practically, and the placement support added real value to my career restart after 8 years. DataMites is the perfect platform to learn, grow, and begin your data science journey.
I joined DataMites for the Data Science course and learned Python, SQL, Machine Learning, and Deep Learning through hands-on projects. The trainers are excellent at explaining concepts clearly. The placement team is very supportive and provides great opportunities thanks to DataMites for helping me start my data science journey.
I joined DataMites after my B.Tech when I developed an interest in Data Science and Machine Learning. The training was well-structured, and I even got an internship opportunity that helped me gain real experience. The placement team was super supportive and guided me through every step. Thanks to DataMites, I’m now placed at Horizon Broadband Pvt. Ltd.
I joined DataMites after completing my BCA, and it was the best decision for my data science career! I learned Python, SQL, Machine Learning, Deep Learning, and NLP, and worked on several capstone and client projects that gave me real-world experience. The trainers and team were always friendly and supportive, patiently clearing all my doubts. Thanks to DataMites, I’m confident and job-ready in data science
I started my data science journey with DataMites, and it’s been an amazing experience! The Certified Data Scientist Program helped me learn everything from scratch through hands-on projects and an internship. The placement team was incredibly supportive, always ready to clarify my doubts. Thanks to their guidance, I successfully got placed. Highly recommend DataMites to anyone starting their data science career
Enrolling at DataMites was one of the best decisions I made for my career. Coming from a freelance writing background with no prior technical experience, I was initially unsure about stepping into the field of data analytics. But DataMites made the transition smooth and achievable. I’d highly recommend them to anyone looking for a guided, industry-ready data analytics course. A true DataMites success story!
SQL is essential for Data Analysts as it enables data extraction, cleaning, and management from relational databases. It forms the foundation for querying, joining tables, and preparing datasets for analysis and visualization.
Professional Data Analysts commonly use SQL, Python, Excel, Tableau, Power BI, R, and Google Analytics. These tools help manage databases, analyze data, and create dashboards for actionable business insights.
The Data Analyst Course in Andheri East emphasizes Python, SQL, Excel, statistics, and visualization tools. It focuses on practical projects, real-world data sets, and business problem-solving to prepare learners for analyst careers.
Yes, basic programming knowledge in Python or R is helpful for aspiring Data Analysts. However, strong skills in SQL, Excel, and visualization tools are equally important and often enough for entry-level roles in data analytics.
Data Analytics is ideal for roles focused on reporting and insights, while Data Science involves advanced machine learning and predictive modeling. In Andheri East, Analytics suits beginners, whereas Data Science fits advanced tech professionals.
Data Analysts work on projects such as sales forecasting, customer segmentation, fraud detection, performance dashboards, trend analysis, and market research. These projects help organizations make data-driven decisions.
Top companies in Mumbai hiring Data Analysts include TCS, Accenture, Infosys, Capgemini, HDFC Bank, ICICI Bank, L&T, Reliance, and e-commerce firms. The city offers opportunities across IT, BFSI, consulting, healthcare, and retail.
A Data Analyst Course teaches core skills like Python programming, SQL databases, Excel functions, visualization with Tableau/Power BI, statistical methods, and practical projects to prepare students for industry-relevant roles.
To start a Data Analyst career in India, essential skills include SQL, Python, Excel, statistics, and data visualization tools like Power BI or Tableau. Knowledge of data cleaning, reporting, and business problem-solving is equally important.
The syllabus of a Data Analyst Course includes Python, SQL, Excel, statistics, data visualization (Tableau/Power BI), data cleaning, reporting, and real-world projects. It equips learners with skills to analyze and interpret business data effectively.
The best Data Analyst Course in Andheri East is one that offers comprehensive training in Python, SQL, Excel, and BI tools, provides internships, career mentorship, and globally recognized certifications to boost employability.
The Certified Data Analyst Course in Andheri East usually lasts 6 months, including live training, hands-on projects, and internships. Some fast-track courses are also available for those seeking quicker completion.
Enrolling in a Data Analyst Course in Andheri East helps learners build in-demand skills like Python, SQL, Power BI, and Excel. It opens doors to lucrative roles in Mumbai’s IT, finance, healthcare, and e-commerce industries.
Graduates in commerce, engineering, IT, statistics, or related fields are eligible. Even non-technical professionals with analytical interest can apply. Basic knowledge of mathematics and logical reasoning is an added advantage.
The fee for a Data Analyst Course in Andheri East typically ranges between ₹20,000 to ₹1,20,000, depending on the institute, course format (online/offline), and additional benefits like internships and placement support.
According to a Mordor Intelligence report (2024), India’s data analytics market is growing at 25% CAGR, creating huge demand for Data Analysts. Andheri East, being a corporate hub, has rising job opportunities for skilled professionals.
To choose the best institute in Mumbai, check for recognized certifications, experienced trainers, internship opportunities, flexible learning formats, strong placement records, and an industry-relevant syllabus covering Python, SQL, and BI tools.
The average salary of Data Analysts in Mumbai ranges from ₹3 to ₹8 LPA, depending on experience, skills, and the company. Professionals with strong expertise in SQL, Python, and visualization tools earn higher packages.
Yes, offline Data Analyst Courses are available in Andheri East. Learners can attend classroom-based sessions, gaining hands-on exposure to tools like SQL, Python, Excel, and Tableau, along with guidance from industry trainers.
Completing a Data Analyst Course opens roles like Business Analyst, Data Scientist, BI Analyst, Data Consultant, and Reporting Analyst. The course equips learners with technical and analytical skills for diverse industries.
Yes, DataMites offers backup classes for students who miss a session. With the Flexi Pass and supportive training structure, learners at Andheri East can reschedule and attend missed classes without losing valuable lessons.
The DataMites training center in Andheri East is centrally located for easy accessibility. Learners can contact the support team for the exact address and directions before visiting the center for their Data Analyst Course.
DataMites Andheri East provides flexible payment options including UPI, net banking, debit/credit cards, and EMI facilities. Learners can choose the method most convenient for them to enroll in the Data Analyst Course.
To enroll in the Data Analyst Course at DataMites Andheri East, learners can register online through the official website or visit the center directly. Guidance from the DataMites support team ensures a smooth enrollment process.
The Flexi Pass at DataMites offers learners access to multiple batches for 3 months, allowing flexible learning, backup classes, and revision opportunities to master Data Analyst concepts effectively.
Yes, DataMites includes internships with the Data Analyst Course in Andheri East, providing practical experience with datasets and business problems, helping learners strengthen their profiles for placement opportunities.
At DataMites Anna Nagar, instructors are certified professionals with expertise in analytics, machine learning, and visualization. They focus on delivering practical, industry-relevant training to prepare learners for analyst careers.
Yes, the DataMites Certified Data Analyst Course is project-based, including live case studies and domain-focused projects. This hands-on learning prepares students to tackle real industry challenges effectively.
DataMites trainers in Andheri East are industry experts with years of experience in analytics, data science, and BI tools. They bring practical insights and mentorship, guiding learners through projects and real-world applications.
The DataMites Certified Data Analyst Course in Andheri East is industry-recognized, IABAC-accredited, and designed with real-world projects, internships, and expert mentoring, ensuring learners gain practical skills and career readiness.
Yes, DataMites offers 100% placement support, including resume building, interview preparation, and job assistance. Many students from Andheri East have secured analyst roles across IT, BFSI, e-commerce, and consulting firms.
DataMites has a transparent refund policy. Learners who cancel their enrollment within the specified time frame are eligible for a refund, subject to terms and conditions mentioned in the DataMites policy guidelines.
The DataMites Certified Data Analyst Course fee in Andheri East ranges between INR 40,000 to INR 70,000, with flexible payment and EMI options. This fee includes training, study materials, projects, internships, and placement support.
DataMites provides study materials, e-books, case studies, recorded sessions, live classes, and real-world datasets. These resources ensure learners build strong foundations in Python, SQL, Excel, statistics, and visualization tools.
Yes, DataMites offers internships with the Certified Data Analyst Course in Andheri East, giving students hands-on exposure to real-world projects that enhance practical learning and prepare them for industry roles.
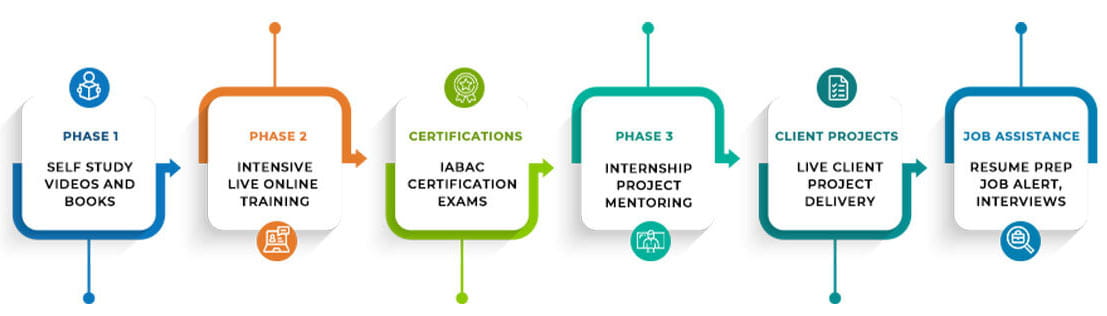
The DataMites Placement Assistance Team(PAT) facilitates the aspirants in taking all the necessary steps in starting their career in Data Science. Some of the services provided by PAT are: -
The DataMites Placement Assistance Team(PAT) conducts sessions on career mentoring for the aspirants with a view of helping them realize the purpose they have to serve when they step into the corporate world. The students are guided by industry experts about the various possibilities in the Data Science career, this will help the aspirants to draw a clear picture of the career options available. Also, they will be made knowledgeable about the various obstacles they are likely to face as a fresher in the field, and how they can tackle.
No, PAT does not promise a job, but it helps the aspirants to build the required potential needed in landing a career. The aspirants can capitalize on the acquired skills, in the long run, to a successful career in Data Science.