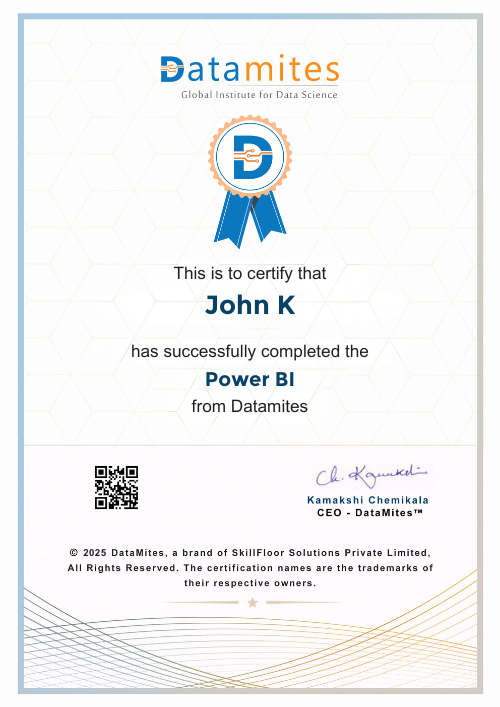
POWER BI CERTIFICATION AUTHORITIES

COURSE FEATURES

POWER BI COURSE LEAD MENTORS

POWER BI COURSE FEES IN INDIA

Live Virtual

Instructor Led Live Online

36,000
28,900

  • Global Certification
  • 3-Month | 70 Learning Hours
  • 32-Hour Live Online Training
  • Capstone & Client Project
  • 365 Days Flexi Pass + Cloud Lab
  • Internship +Job Assistance

Blended Learning

Self Learning + Live Mentoring

22,000
12,900

  • Self Learning + Live Mentoring
  • Global Certification
  • 1 Year Access To Elearning
  • Capstone & Client Project
  • Job Assistance
  • 24*7 Learner assistance and support

Classroom

In - Person Classroom Training

45,000
31,900

  • Global Certification
  • 3-Month | 70 Learning Hours
  • 32-Hour Classroom Sessions
  • Capstone & Client Project
  • Cloud Lab Access
  • Internship +Job Assistance

ARE YOU LOOKING TO UPSKILL YOUR TEAM ?

Enquire Now

WHY DATAMITES INSTITUTE FOR POWER BI COURSE

Why DataMites Infographic

SYLLABUS OF POWER BI TRAINING IN INDIA

  • What is PowerBI?
  • Download and Install Power BI Desktop
  • Quick Interface Tour
  • Mini Project: Transform Data
  • Mini Project: Visualize Data
  • Mini Project: Creating a Data Model
  • Exploring Query Editor
  • Connecting to our DataSource
  • Editing Rows
  • Changing DataTypes
  • Replacing values
  • Close and Apply
  • Connecting to a CSV File
  • Connecting to a Webpage
  • Extracting Characters
  • Splitting and Merging Columns
  • Creating Conditional Columns
  • Creating Columns from Examples
  • Merging Queries
  • Pivoting and Unpivoting
  • Appending Queries
  • Practice and Solution:Population Table
  • The Fact-Dimension-Model
  • Practice:Load the Dimension Table
  • Organizing Our Querires in Groups
  • Entering Data Manually
  • Creating an Index Column
  • Workflow and More Transformation
  • Module Summary
  • Practice Assignment 1
  • Advanced Editor-Best Practices
  • Performance: References Versus Duplicating
  • Performance: Enable/Disable Load and Report Refresh
  • Group By
  • Mathematical Operations
  • Run Python Script
  • Using Parameters to Dynamically Transform Data
  • M Formula Language:Basics
  • M Formula Language:Values, Lists, and Tables
  • M Formula Language: Functions
  • Why a Data Model?
  • Create and Edit Relationships
  • One-to-Many and One-to_One Relationship
  • Many-to-Many(m:n) Relationship
  • Cross-Filter Direction
  • Activate and Deactivate Relationships
  • Practice Assignment 2
  • Our First Visual
  • The Format Tab
  • Understanding Tables
  • Conditional Formatting
  • The Pie Chart
  • All about the filter Visual
  • The Filter Pane for Developers
  • Cross Filtering and Edit Interactions
  • Practice Assignment 3
  • Synching Slicers across Pages
  • Creating Drilldowns
  • Creating Drill-Throughs
  • The Treemap Visual
  • The Decomposition Tree
  • Understanding the Matrix Visual
  • Editing Pages
  • Buttons and Actions
  • Bookmarks to Customize Your Report
  • Analytics and Forecasts with Line Charts
  • Working with Custom Visuals
  • Get Data Using Python Script
  • Python in Power BI
  • Setting Up Python for Power BI
  • Transforming Data Using Python
  • Creating Visualizations Using Python
  • Violin Plots, Pair Plots and Ridge Plots Using Python
  • Machine Learning (BayesTextAnalyzer) Using Python
  • Introduction
  • The Project Data
  • Measures Versus Calculated Columns
  • Automatically Creating a Data Table in DAX
  • Calender
  • Creating a Complete Data Table with Features
  • Creating a Key Measure Table
  • Aggregation Functions
  • The Different Versions of COUNT
  • SUMX- Row-Based Calculations
  • CALCULATE- The Basics
  • Changing the Context with FILTER
  • ALL
  • ALLSELECT
  • ALLEXCEPT
  • Introduction - Best Practices
  • Show Emphaty and Identify the Requirements
  • Find the Most Suitable KPIs
  • Choose and Effective Visual
  • Make Use of Natural Reading Patters
  • Tell a Story Using Visual Cues
  • Avoid Chaos and Group Information
  • JSON and REST API
  • Setting UP a Local MYSQL Database
  • Connecting to a MYSQL Databased in Power BI
  • Connecting to a SQL Database (PostgreSQL)

POWER BI CERTIFICATION COURSE REVIEWS

ABOUT DATAMITES POWER BI COURSE IN INDIA

In the thriving tech landscape of India, Power BI is emerging as a game-changer in the business intelligence domain. With 18460+ of Power BI job openings in India, the demand for skilled professionals in this field is soaring. (Naukri) Power BI's innovative approach to data visualization and business analytics is reshaping how industries operate and make decisions.

DataMites, a globally recognized leader in data science education, offers comprehensive Power BI Training in India, tailored to meet the demands of the Indian market. Our programs cover a range of topics including data analytics, machine learning, artificial intelligence, python, data engineering, MLOps, and more. The Power BI course in India is meticulously designed to empower learners with the skills needed to harness the full potential of Power BI in solving real-world business challenges.

Accredited by prestigious organizations like IABAC, Jain University, and NASSCOM, DataMites ensures world-class quality in its curriculum and delivery. The course spans three months, featuring a blend of pre-course study, intensive live training, and practical exposure through internships and project mentorship.

DataMites Power BI Course Curriculum Highlights:

  1. Three-Phase Learning Model: Our unique approach includes 1.5 months of pre-course self-learning, followed by 1.5 months of live, interactive online training, culminating in hands-on experience through internships and project work.
  2. Expert Mentors: Learn from industry veterans with years of experience, who bring real-world insights into the classroom.
  3. Flexible Learning Options: Choose between self-paced study, online Power BI courses in India, or Powe BI classroom training in India across various Indian cities.
  4. Practical Exposure: Work on live projects and Power BI course with internships in India to gain real-world experience and enhance your job readiness.
  5. Placement Support: Our dedicated placement team provides extensive Power BI training with placement in India to help you secure coveted roles in the business intelligence landscape.

As a Power BI professionals in India, you can expect lucrative career opportunities. The average salary for a Power BI Developer in India is INR 6,00,000 LPA which is competitive, reflecting the high demand for these skills. Our Power BI course equips you not just with technical expertise but also with industry insights, making you a sought-after professional in this dynamic field.

Join our Power BI course in India to embark on a rewarding career journey in the realm of business intelligence, and position yourself at the forefront of the data-driven revolution in India!

ABOUT POWER BI TRAINING IN INDIA

Defined by Microsoft, Power BI stands as a comprehensive business analytics tool, enabling organizations to share insights, visualize data effectively, and integrate analytics into apps and websites. Its value and versatility stem from its suite of products and services, which are most effective when utilized individually and collectively.

The Power BI suite comprises several essential tools:

  • Power BI Desktop: Installed on Windows, this tool facilitates self-service data analysis and report generation.
  • Power BI Service: This is a secure, Microsoft-hosted cloud service for viewing dashboards, reports, and Power BI apps.
  • Power BI Data Gateway: Necessary for accessing data on an on-premises network.
  • Power BI Report Server: A local report server allowing access to reports through browsers, mobile devices, or email.
  • Power BI Mobile Apps: Apps for iOS, Android, and Windows 10 mobile devices to interact with data on the go.

Power BI's user base is diverse, extending well beyond data specialists like data scientists or engineers. It's specifically designed to be user-friendly for non-technical users, allowing them to easily create reports, work with data, and conduct thorough data analysis.

Power BI offers the capability to process and handle vast data sets from diverse sources, a task too demanding for tools like Excel. It is an assembly of software solutions, apps, and connectors, all working together to turn a variety of data sources into cohesive, visually appealing, and interactive insights. In essence, Power BI uses organizational data to generate reports and present key insights.

Power BI is built on six core components:

  • Power Query: A tool for data transformation and mash-up.
  • Power Pivot: Used for in-memory tabular data modeling.
  • Power View: A tool dedicated to data visualization.
  • Power Map: For 3D spatial data visualization.
  • Power Q&A: A natural language question-and-answer engine.
  • Power BI Desktop: The companion development tool for Power BI.

As per Microsoft's announcement at the Microsoft Business Application Conference, Power BI is used by 97% of Fortune 500 companies. Notable features of Power BI include:

  • Ease of setup.
  • Swift insight generation.
  • Real-time data processing with natural language queries.
  • Quick decision-making capabilities.
  • Integration with various news and media platforms like Go Freedom.
  • A user-friendly interface.
  • Compatibility with numerous external services.
  • Excellent data compression.
  • Simplified sharing and publishing options.
  • Easy integration of detailed R visualizations.

The demand for Microsoft Power BI specialists is currently high. Power BI offers a promising career path for those interested in business intelligence and analytics. It serves as an excellent stepping stone for those aiming to venture into data science, providing foundational skills and knowledge. The field is lucrative, with top companies offering rewarding career opportunities in Power BI.

While Power BI and Tableau are similar in many respects, a common perception is that Power BI tends to be more beginner-friendly. Tableau might present a steeper learning curve for those not already versed in data analytics. Both platforms offer excellent, intuitive user interfaces. Power BI is noted for its quick setup and ability to provide instant insights. It is generally considered more cost-effective and user-friendly compared to Tableau.

Due to its user-friendliness and dynamic visualization capabilities, Power BI is highly regarded in the toolkit of business intelligence tools. It empowers end-users with self-service analytics for creating reports and dashboards. In India, Power BI professionals can find opportunities in roles such as:

  • Data Analyst
  • Business Analyst
  • Business Intelligence Analyst
  • Power BI Analyst
  • Power BI Developer
  • Business Intelligence Developer
  • Business Intelligence Manager

The market for Power BI developers is buzzing, and their skills are increasingly sought after to enhance operational efficiencies in businesses. Power BI is utilized by over 18,000 companies globally, securing a significant 5.8% share in the business intelligence market, highlighting its widespread adoption and influence. This growth trajectory underscores the continual demand for Power BI developers. As such, professionals in this field can anticipate a steady rise in both the quality of job opportunities and salary packages with increasing experience. Starting strong in this field paves the way for a prosperous career.

Salaries for Power BI Developers vary globally, reflecting their growing demand and experience levels. Here's a look at average annual salaries in various countries:

  • In the United States, the average yearly salary is around USD 107,250 (Source: Talent.com).
  • In the United Kingdom, Power BI Developers earn about £45,024 annually (Source: Talent.com).
  • In India, the average annual compensation is approximately INR 5,20,000 (Source: Glassdoor).
  • Canadian professionals with Power BI skills earn about C$99,450 per year (Source: Talent.com).
  • In Australia, the average salary stands at AUD 130,000 per year (Source: Talent.com).
  • In the UAE, individuals with Power BI expertise earn about AED 124,000 annually (Source: Payscale).
  • In Saudi Arabia, the average annual salary is SAR 147,000 (Source: Payscale.com).
  • South African Power BI Developers earn around ZAR 855,000 per year (Source: Talent.com).
  • In Germany, the average annual salary is around 49,000 EUR (Source: Payscale).
  • Swiss professionals with Power BI skills earn about CHF 103,000 per year (Source: Payscale).
View more

FAQ’S OF POWER BI COURSE IN INDIA

DataMites™ stands out as a premier global institute in data science, endorsed by the International Association of Business Analytics Certifications (IABAC). Key reasons to choose DataMites include:

  • Expert Instructors: The trainers are industry veterans with hands-on experience, ensuring practical learning.
  • Extensive Training Reach: More than 50,000 aspirants have been trained, showcasing the institute's widespread impact.
  • Three-Phase Learning Methodology: A carefully crafted teaching method ensures comprehensive training for the best learning experience.
  • Practical Experience: Engage with stimulating projects and case studies to apply learning in real-world scenarios.
  • Career Support: Offers internships and job readiness assistance to facilitate smooth transitions into professional roles.

This course is ideal for a wide range of professionals working with data across various industries. It benefits:

Data analysts, BI specialists, reporting professionals, and others in similar roles.Individuals eager to master Power BI tools and craft customized visual reports.

The DataMites Power BI Course in India is designed to provide a thorough understanding of Power BI and its diverse applications. The course delves into:

  • In-depth knowledge of BI tools and their functionality across contexts.
  • Detailed exploration of Power BI's desktop and mobile applications, blending theoretical and practical knowledge.
  • Enhancement of business intelligence skills, with insights into the latest trends in business analytics and data visualization for strategic planning.

The fee for Power BI Training in India typically ranges between 15,000 INR to 25,000 INR, catering to different learning needs and budgets.

The duration of the Power BI Course at DataMites is set for a period of three months.

DataMites' Power BI course is led by a team of experts who are well-versed and highly qualified in the Power BI domain. These instructors are committed to delivering top-notch training, ensuring you're up to date with the latest industry practices.

DataMites does offer the flexibility of online Power BI training. This allows you to learn and excel in Power BI conveniently from your home. The online courses are designed to be just as engaging and effective as in-person sessions.

Certainly, DataMites provides in-person, classroom training for Power BI in several Indian cities including India, Chennai, Pune, and Hyderabad. Classroom training can also be arranged in other cities based on student demand.

For enrolling in the Power BI training, you have several payment options at your disposal, including:

  • Credit Card
  • MasterCard
  • Personal or Business Checks
  • PayPal
  • Visa
  • American Express
  • Cash Payments
  • Net Banking
  • Debit Card

The Flexi-Pass for Power BI training by DataMites® in India provides an extended duration of three months. During this period, participants have the flexibility to attend various sessions related to any specific queries or revisions they may have in their Power BI training.

Yes, DataMites offers comprehensive placement support after course completion. The dedicated Placement Assistance Team (PAT) at DataMites will guide you through the job search process and interview preparations.

The DataMites Placement Assistance Team(PAT) facilitates the aspirants in taking all the necessary steps in starting their career in Data Science. Some of the services provided by PAT are: -

  • 1. Job connect
  • 2. Resume Building
  • 3. Mock interview with industry experts
  • 4. Interview questions

The DataMites Placement Assistance Team(PAT) conducts sessions on career mentoring for the aspirants with a view of helping them realize the purpose they have to serve when they step into the corporate world. The students are guided by industry experts about the various possibilities in the Data Science career, this will help the aspirants to draw a clear picture of the career options available. Also, they will be made knowledgeable about the various obstacles they are likely to face as a fresher in the field, and how they can tackle.

No, PAT does not promise a job, but it helps the aspirants to build the required potential needed in landing a career. The aspirants can capitalize on the acquired skills, in the long run, to a successful career in Data Science.

View more

OTHER POWER BI TRAINING CITIES IN INDIA

popular career ORIENTED COURSES

DATAMITES POPULAR COURSES


HELPFUL RESOURCES - DataMites Official Blog