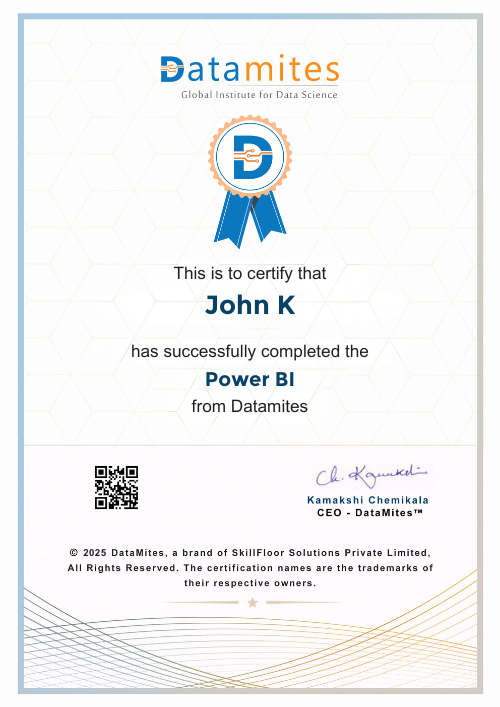
POWER BI CERTIFICATION AUTHORITIES

COURSE FEATURES

POWER BI COURSE LEAD MENTORS

POWER BI COURSE FEES IN PUNE

Live Virtual

Instructor Led Live Online

36,000
36,885

  • Global Certification
  • 3-Month | 70 Learning Hours
  • 32-Hour Live Online Training
  • Capstone & Client Project
  • 365 Days Flexi Pass + Cloud Lab
  • Internship +Job Assistance

Blended Learning

Self Learning + Live Mentoring

22,000
16,464

  • Self Learning + Live Mentoring
  • Global Certification
  • 1 Year Access To Elearning
  • Capstone & Client Project
  • Job Assistance
  • 24*7 Learner assistance and support

Classroom

In - Person Classroom Training

45,000
40,713

  • Global Certification
  • 3-Month | 70 Learning Hours
  • 32-Hour Classroom Sessions
  • Capstone & Client Project
  • Cloud Lab Access
  • Internship +Job Assistance

ARE YOU LOOKING TO UPSKILL YOUR TEAM ?

Enquire Now

WHY DATAMITES INSTITUTE FOR POWER BI COURSE

Why DataMites Infographic

SYLLABUS OF POWER BI TRAINING IN PUNE

  • What is PowerBI?
  • Download and Install Power BI Desktop
  • Quick Interface Tour
  • Mini Project: Transform Data
  • Mini Project: Visualize Data
  • Mini Project: Creating a Data Model
  • Exploring Query Editor
  • Connecting to our DataSource
  • Editing Rows
  • Changing DataTypes
  • Replacing values
  • Close and Apply
  • Connecting to a CSV File
  • Connecting to a Webpage
  • Extracting Characters
  • Splitting and Merging Columns
  • Creating Conditional Columns
  • Creating Columns from Examples
  • Merging Queries
  • Pivoting and Unpivoting
  • Appending Queries
  • Practice and Solution:Population Table
  • The Fact-Dimension-Model
  • Practice:Load the Dimension Table
  • Organizing Our Querires in Groups
  • Entering Data Manually
  • Creating an Index Column
  • Workflow and More Transformation
  • Module Summary
  • Practice Assignment 1
  • Advanced Editor-Best Practices
  • Performance: References Versus Duplicating
  • Performance: Enable/Disable Load and Report Refresh
  • Group By
  • Mathematical Operations
  • Run Python Script
  • Using Parameters to Dynamically Transform Data
  • M Formula Language:Basics
  • M Formula Language:Values, Lists, and Tables
  • M Formula Language: Functions
  • Why a Data Model?
  • Create and Edit Relationships
  • One-to-Many and One-to_One Relationship
  • Many-to-Many(m:n) Relationship
  • Cross-Filter Direction
  • Activate and Deactivate Relationships
  • Practice Assignment 2
  • Our First Visual
  • The Format Tab
  • Understanding Tables
  • Conditional Formatting
  • The Pie Chart
  • All about the filter Visual
  • The Filter Pane for Developers
  • Cross Filtering and Edit Interactions
  • Practice Assignment 3
  • Synching Slicers across Pages
  • Creating Drilldowns
  • Creating Drill-Throughs
  • The Treemap Visual
  • The Decomposition Tree
  • Understanding the Matrix Visual
  • Editing Pages
  • Buttons and Actions
  • Bookmarks to Customize Your Report
  • Analytics and Forecasts with Line Charts
  • Working with Custom Visuals
  • Get Data Using Python Script
  • Python in Power BI
  • Setting Up Python for Power BI
  • Transforming Data Using Python
  • Creating Visualizations Using Python
  • Violin Plots, Pair Plots and Ridge Plots Using Python
  • Machine Learning (BayesTextAnalyzer) Using Python
  • Introduction
  • The Project Data
  • Measures Versus Calculated Columns
  • Automatically Creating a Data Table in DAX
  • Calender
  • Creating a Complete Data Table with Features
  • Creating a Key Measure Table
  • Aggregation Functions
  • The Different Versions of COUNT
  • SUMX- Row-Based Calculations
  • CALCULATE- The Basics
  • Changing the Context with FILTER
  • ALL
  • ALLSELECT
  • ALLEXCEPT
  • Introduction - Best Practices
  • Show Emphaty and Identify the Requirements
  • Find the Most Suitable KPIs
  • Choose and Effective Visual
  • Make Use of Natural Reading Patters
  • Tell a Story Using Visual Cues
  • Avoid Chaos and Group Information
  • JSON and REST API
  • Setting UP a Local MYSQL Database
  • Connecting to a MYSQL Databased in Power BI
  • Connecting to a SQL Database (PostgreSQL)

POWER BI CERTIFICATION COURSE REVIEWS

ABOUT DATAMITES POWER BI COURSE IN PUNE

Mordor Intelligence projects that the Business Intelligence (BI) Market would grow at a CAGR of 12% between 2023 and 2028. The market share of business intelligence (BI) and analytics products has grown dramatically over time thanks to numerous powerful, well-established competitors in the fiercely competitive international industry. Power BI has risen to the top of the business analytics field among all BI technologies. 

DataMites is a top-tier supplier of data science training on a global scale, with a focus on courses in data analytics, machine learning, artificial intelligence, data engineering, python, MLOps, and more! DataMites is offering Microsoft Power BI classes in Pune with an emphasis on increasing productivity and tackling actual business issues in order to help individuals make the most of Power BI. This Power BI course is intended for students who wish to become proficient with the Power BI tools and create customized visual reports.

DataMites has earned accreditation from IABAC, Jain University, and NASSCOM, three globally renowned organizations that excel in the business and academic worlds. DataMites' Power BI Training in Pune will be available for a duration of three months and will contain a thorough and extremely engaging curriculum in order to ensure the efficient transfer of information in the field. The Power BI Courses in Pune follow a three-phase system, with Phase 1 comprising of self-study prior to the course for 11/2 months, Phase 2 consisting of rigorous live online instruction for 11/2 months, and Phase 3 consisting of an internship, project mentorship, and end-to-end career counseling.

You will obtain practical experience with the aid of this Power BI Training in Pune through live interactive projects, client projects, and internship chances in Pune. At DataMites, a dedicated team of placement specialists is ready to help students find suitable employment in the business intelligence area after the course.

Highlights of DataMites Power BI Training; 

  1. Comprehensive knowledge of this BI technology and how it functions in various situations.
  2. 3 Phase of Learning
  3. With many years of active industry experience, knowledgeable faculty serve as mentors.
  4. Self-study, an online Power BI course in Pune, and a Power BI course offline in Pune are all flexible learning alternatives in Pune.
  5. Chances for internships and real-world projects.
  6. The Placement Assistance Team to ensure Job-Ready Support.

Pune is presently a well-liked place for tech startups and business entrepreneurs as a result of its rapid expansion. In the 2018 study "Rise of Global Startup" by the Centre of American Entrepreneurship, Pune was named an emerging startup hotspot in the "Global Next" category. To stand out in the business intelligence and analytics industry in Pune, Power BI is a wise career choice. According to glassdoor.com, a Power BI Developer in Pune earns an average yearly income of 4,65,689 a year. With skills in Power BI, you have the chance to get about 5,00,000 LPA in Pune, as per the Payscale data. If you're interested in acquiring experience and expanding your skill set, learning Power BI is a wonderful way to start.

ABOUT POWER BI TRAINING IN PUNE

Power BI is the collective term for a number of cloud-based applications and services that assist businesses in gathering, managing, and analyzing data from many sources through an intuitive user interface. Data analysis and data visualization are both capabilities of Microsoft's Power BI, a cloud-based corporate analytics solution. With reports and analytics, Microsoft Power BI gives you a platform to be creative and productive.

Massive volumes of data from many sources are available to Power BI. It gives you the ability to see, examine, and visualize vast volumes of data that Excel is unable to open. A collection of software services, programs, and connectors called Power BI works together to turn various data sources into comprehensible, captivating graphics and interactive insights. Microsoft Power BI is used to generate reports and display insights from information from an organization.

Each of the components that make up Power BI is;

  • The installation of Power BI Desktop on a Windows machine enables self-service data analysis and report creation.
  • Users can see dashboards, reports, and Power BI services via the Microsoft-hosted secure cloud service Power BI.
  • Power BI Data Gateway - You need Power BI Gateway installed in order to access data that is present on an on-premises network.
  • Power BI Report Server - A locally installed report server is referred to as a Report Server. Users can obtain the reports by email, mobile device, or computer browser.
  • With the Power BI mobile apps on iOS, Android, and Windows 10 mobile devices, users can connect to and interact with data.

Power BI users are not simply limited to data experts like data scientists or data engineers; they can range far across the spectrum of diverse company personnel. Indeed, the platform was built expressly to make it simple for non-technical people to create reports, work with data, and do in-depth data analysis tasks.

Power BI is comprised of six primary components, including;

  • Power Query is a tool for the mashup and manipulation of data.
  • Tabular data can be modeled in memory using Power Pivot.
  • A tool for visualizing data is called Power View.
  • With Power Map, you may visualize 3D spatial data.
  • Using natural language, Power Q&A is a question-and-answer engine.
  • Power BI Desktop is a support tool for Power BI.

There aren't many differences between the two, however, many believe that Power BI is a little easier for beginners to use than Tableau. If you're not a data analyst, Tableau's learning curve can be a little more difficult for you. Yet, both have excellent user interfaces and are simple to use. In a nutshell, Power BI is speedier and offers information right away. It is more user-friendly and cheaper than Tableau.

Microsoft apparently acknowledged during the Microsoft Business Application Conference that 97% of Fortune 500 companies currently use Power BI. These are a few of Power BI's strongest qualities.

  • Simple to put together
  • Quick insights
  • Real-time data Natural language inquiries
  • Rapid decisions
  • Easy-to-use interface
  • Integration with outside services
  • Amazing data compression skills
  • Communication and publication made easier
  • It is simple to add intricate R visualizations.

Studies show that there is a great need now for Microsoft Power BI specialists. For anyone interested in a career in business intelligence and analytics, Power BI is a wise career choice. Getting a career in business intelligence or Power BI is an excellent way to start developing your knowledge and abilities if you intend to switch to data science in the future. And that's great because reputable businesses provide lucrative Power BI career prospects.

Power BI tops the list of popular tools thanks to its ease of use and dynamic visualization. It gives end users the chance to create dashboards and reports using self-service analytics. The following in-demand career options could be provided by the Power BI;

  • Data Analyst
  • Business Analyst
  • Business Intelligence Analyst
  • Power BI Analyst
  • Power BI Developer
  • Business Intelligence Developer
  • Business Intelligence Manager

Job opportunities and compensation packages for power BI developers expand as you gain experience.

  • The national average salary for a Power BI Developer is USD 107,250 per year in the United States. (Talent.com)
  • The national average salary for a Power BI Developer is £45,024 per annum in the UK.  (Talent.com)
  • The national average salary for a Power BI Developer is INR 5,20,000 per year in India. (Glassdoor)
  • The national average salary for a person with Power BI Skills is C$99,450 per year in Canada. (Talent.com)
  • The national average salary for a Power BI Developer is AUD 130,000 per year in Australia. (Talent.com)
  • The national average salary for a person with skills in Power BI is AED 124,000 per year in UAE. (Payscale)
  • The national average salary for a person with skills in Power BI is SAR 147,000 per year in Saudi Arabia. (Payscale.com)
  • The national average salary for a Power BI Developer is ZAR 855,000 per year in South Africa. (Talent.com)
  • The national average salary for a person with Power BI skills is 49,000 EUR per annum in Germany. (Payscale)
  • The national average salary for a person with skills in Power BI is CHF 103,000 per year in Switzerland. (Payscale)

A Power BI Developer’s salary in Pune is 4,65,689 LPA as per Glassdoor data.

Businesses want these specialists in order for their operations to run more efficiently, and these roles are known as Power BI developers in the market. Power BI jobs may become more necessary as the size of the worldwide intelligence market is predicted to expand by US$ 33.3 billion by 2025 at a 7.6% CAGR over the projected timeframe. Programmers with this skill set will always be in demand, given how crucial Power BI developers are to any company. If you start off well, you have a chance of having a successful career. Your level of experience increases along with the standard of jobs and power BI developer salary packages.

View more

FAQ’S OF POWER BI COURSE IN PUNE

The International Association of Business Analytics Certifications (IABAC) has awarded the designation of recognition to DataMitesTM, a global institute for data science.

  • The main mentors have extensive industry knowledge and current employment.
  • DataMites has trained more than 50,000 aspirants.
  • An organized three-phase learning process is created to deliver the best instruction possible.
  • Participate in compelling projects and case studies.
  • Opportunities for internships and support with career preparedness.

Participants will leave the DataMites Power BI Course with a thorough understanding of this BI technology and how it functions in a number of situations. Also, in order to impart the necessary domain expertise both conceptually and practically, the course will cover the three essential components of the desktop and mobile Power BI apps in great detail. With the aid of Power BI, you may improve your business intelligence skills. To make your strategic planning sessions more effective, become knowledgeable about the most recent developments in business analytics and data visualization.

It is also useful for data analysts, BI and reporting specialists, and other professionals who work with data in any business. For people who wish to learn how to use the Power BI tools and produce personalized visual reports, this Power BI course is appropriate.

The Power BI Training Fee in Pune can generally vary from 15,000 INR to 25,000 INR.

The Power BI Course at DataMites will last three months.

The instructors at DataMites are experts in the field of Power BI and possess a high level of training. They guarantee that you are properly instructed and given instructions on the most recent industry requirements.

You will receive placement services, such as help with job hunting and interview preparation, from DataMites' dedicated Placement Assistance Team (PAT), when you complete the course, without a doubt.

Indeed, DataMites allows you the convenience of learning and mastering Power BI at home. Our online Power BI courses are incredibly interactive and just as effective as those taken in person.

Mumbai, Pune, Chennai, Pune, and Hyderabad in India are among the cities where DataMites offers classroom training for Power BI. In other cities, we are happy to conduct a classroom session for the students ON DEMAND.

You have three months to attend DataMites® sessions related to any query or revision you wish to pass with our Flexi-Pass for Power BI training in Pune.

You could use it to pay;

  • Credit Card
  • Master card
  • Check
  • PayPal
  • Visa
  • American Express
  • Cash
  • Net Banking
  • Debit Card

The DataMites Placement Assistance Team(PAT) facilitates the aspirants in taking all the necessary steps in starting their career in Data Science. Some of the services provided by PAT are: -

  • 1. Job connect
  • 2. Resume Building
  • 3. Mock interview with industry experts
  • 4. Interview questions

The DataMites Placement Assistance Team(PAT) conducts sessions on career mentoring for the aspirants with a view of helping them realize the purpose they have to serve when they step into the corporate world. The students are guided by industry experts about the various possibilities in the Data Science career, this will help the aspirants to draw a clear picture of the career options available. Also, they will be made knowledgeable about the various obstacles they are likely to face as a fresher in the field, and how they can tackle.

No, PAT does not promise a job, but it helps the aspirants to build the required potential needed in landing a career. The aspirants can capitalize on the acquired skills, in the long run, to a successful career in Data Science.

View more

OTHER POWER BI TRAINING CITIES IN INDIA

popular career ORIENTED COURSES

DATAMITES POPULAR COURSES


HELPFUL RESOURCES - DataMites Official Blog