4.9 (16,900) reviews
 110,000
55,451*
NO COST EMI : 9,242 p.m for 6 Months
*Offer valid till 12th April 2026
Instructor Led Live Online
Self Learning + Live Mentoring
In - Person Classroom Training


MODULE 1: DATA ANALYSIS FOUNDATION
• Data Analysis Introduction
• Data Preparation for Analysis
• Common Data Problems
• Various Tools for Data Analysis
• Evolution of Analytics domain
MODULE 2: CLASSIFICATION OF ANALYTICS
• Four types of the Analytics
• Descriptive Analytics
• Diagnostics Analytics
• Predictive Analytics
• Prescriptive Analytics
• Human Input in Various type of Analytics
MODULE 3: CRIP-DM Model
• Introduction to CRIP-DM Model
• Business Understanding
• Data Understanding
• Data Preparation
• Modeling, Evaluation, Deploying,Monitoring
MODULE 4: UNIVARIATE DATA ANALYSIS
• Summary statistics -Determines the value’s center and spread.
• Measure of Central Tendencies: Mean, Median and Mode
• Measures of Variability: Range, Interquartile range, Variance and Standard Deviation
• Frequency table -This shows how frequently various values occur.
• Charts -A visual representation of the distribution of values.
MODULE 5: DATA ANALYSIS WITH VISUAL CHARTS
• Line Chart
• Column/Bar Chart
• Waterfall Chart
• Tree Map Chart
• Box Plot
MODULE 6: BI-VARIATE DATA ANALYSIS
• Scatter Plots
• Regression Analysis
• Correlation Coefficients
MODULE 1: PYTHON BASICS
• Introduction of python
• Installation of Python and IDE
• Python Variables
• Python basic data types
• Number & Booleans, strings
• Arithmetic Operators
• Comparison Operators
• Assignment Operators
MODULE 2: PYTHON CONTROL STATEMENTS
• IF Conditional statement
• IF-ELSE
• NESTED IF
• Python Loops basics
• WHILE Statement
• FOR statements
• BREAK and CONTINUE statements
MODULE 3: PYTHON DATA STRUCTURES
• Basic data structure in python
• Basics of List
• List: Object, methods
• Tuple: Object, methods
• Sets: Object, methods
• Dictionary: Object, methods
MODULE 4: PYTHON FUNCTIONS
• Functions basics
• Function Parameter passing
• Lambda functions
• Map, reduce, filter functions
MODULE 1 : OVERVIEW OF STATISTICS
MODULE 2 : HARNESSING DATA
MODULE 3 : EXPLORATORY DATA ANALYSIS
MODULE 4 : HYPOTHESIS TESTING
MODULE 1: COMPARISION AND CORRELATION ANALYSIS
• Data comparison Introduction,
• Performing Comparison Analysis on Data
• Concept of Correlation
• Calculating Correlation with Excel
• Comparison vs Correlation
• Hands-on case study : Comparison Analysis
• Hands-on case study Correlation Analysis
MODULE 2: VARIANCE AND FREQUENCY ANALYSIS
• Variance Analysis Introduction
• Data Preparation for Variance Analysis
• Performing Variance and Frequency Analysis
• Business use cases for Variance Analysis
• Business use cases for Frequency Analysis
MODULE 3: RANKING ANALYSIS
• Introduction to Ranking Analysis
• Data Preparation for Ranking Analysis
• Performing Ranking Analysis with Excel
• Insights for Ranking Analysis
• Hands-on Case Study: Ranking Analysis
MODULE 4: BREAK EVEN ANALYSIS
• Concept of Breakeven Analysis
• Make or Buy Decision with Break Even
• Preparing Data for Breakeven Analysis
• Hands-on Case Study: Manufacturing
MODULE 5: PARETO (80/20 RULE) ANALSYSIS
• Pareto rule Introduction
• Preparation Data for Pareto Analysis,
• Performing Pareto Analysis on Data
• Insights on Optimizing Operations with Pareto Analysis
• Hands-on case study: Pareto Analysis
MODULE 6: Time Series and Trend Analysis
• Introduction to Time Series Data
• Preparing data for Time Series Analysis
• Types of Trends
• Trend Analysis of the Data with Excel
• Insights from Trend Analysis
MODULE 7: DATA ANALYSIS BUSINESS REPORTING
• Management Information System Introduction
• Various Data Reporting formats
• Creating Data Analysis reports as per the requirements
MODULE 1: DATA ANALYTICS FOUNDATION
• Business Analytics Overview
• Application of Business Analytics
• Benefits of Business Analytics
• Challenges
• Data Sources
• Data Reliability and Validity
MODULE 2: OPTIMIZATION MODELS
• Predictive Analytics with Low Uncertainty;Case Study
• Mathematical Modeling and Decision Modeling
• Product Pricing with Prescriptive Modeling
• Assignment 1 : KERC Inc, Optimum Manufacturing Quantity
MODULE 3: PREDICTIVE ANALYTICS WITH REGRESSION
• Mathematics behind Linear Regression
• Case Study : Sales Promotion Decision with Regression Analysis
• Hands on Regression Modeling in Excel
MODULE 4: DECISION MODELING
• Predictive Analytics with High Uncertainty
• Case Study-Monte Carlo Simulation
• Comparing Decisions in Uncertain Settings
• Trees for Decision Modeling
• Case Study : Supplier Decision Modeling - Kickathlon Sports Retailer
MODULE 1: MACHINE LEARNING INTRODUCTION
• What Is ML? ML Vs AI
• ML Workflow, Popular ML Algorithms
• Clustering, Classification And Regression
• Supervised Vs Unsupervised
MODULE 2: ML ALGO: LINEAR REGRESSSION
• Introduction to Linear Regression
• How it works: Regression and Best Fit Line
• Hands-on Linear Regression with ML Tool
MODULE 3: ML ALGO: LOGISTIC REGRESSION
• Introduction to Logistic Regression;
• Classification & Sigmoid Curve
• Hands-on Logistics Regression with ML Tool
MODULE 4: ML ALGO: KNN
• Introduction to KNN; Nearest Neighbor
• Regression with KNN
• Hands-on: KNN with ML Tool
MODULE 5: ML ALGO: K MEANS CLUSTERING
• Understanding Clustering (Unsupervised)
• Introduction to KMeans and How it works
• Hands-on: K Means Clustering
MODULE 6: ML ALGO: DECISION TREE
• Decision Tree and How it works
• Hands-on: Decision Tree with ML Tool
MODULE 7: ML ALGO: SUPPORT VECTOR MACHINE (SVM)
• Introduction to SVM
• How It Works: SVM Concept, Kernel Trick
• Hands-on: SVM with ML Tool
MODULE 8: ARTIFICIAL NEURAL NETWORK (ANN)
• Introduction to ANN, How It Works
• Back propagation, Gradient Descent
• Hands-on: ANN with ML Tool
MODULE 1: DATABASE INTRODUCTION
• DATABASE Overview
• Key concepts of database management
• CRUD Operations
• Relational Database Management System
• RDBMS vs No-SQL (Document DB)
MODULE 2: SQL BASICS
• Introduction to Databases
• Introduction to SQL
• SQL Commands
• MY SQL workbench installation
MODULE 3: DATA TYPES AND CONSTRAINTS
• Numeric, Character, date time data type
• Primary key, Foreign key, Not null
• Unique, Check, default, Auto increment
MODULE 4: DATABASES AND TABLES (MySQL)
• Create database
• Delete database
• Show and use databases
• Create table, Rename table
• Delete table, Delete table records
• Create new table from existing data types
• Insert into, Update records
• Alter table
MODULE 5: SQL JOINS
• Inner join, Outer Join
• Left join, Right Join
• Self Join, Cross join
• Windows Functions: Over, Partition, Rank
MODULE 6: SQL COMMANDS AND CLAUSES
• Select, Select distinct
• Aliases, Where clause
• Relational operators, Logical
• Between, Order by, In
• Like, Limit, null/not null, group by
• Having, Sub queries
MODULE 7: DOCUMENT DB/NO-SQL DB
• Introduction of Document DB
• Document DB vs SQL DB
• Popular Document DBs
• MongoDB basics
• Data format and Key methods
• MongoDB data management
MODULE 1: BIG DATA INTRODUCTION
• Big Data Overview
• Five Vs of Big Data
• What is Big Data and Hadoop
• Introduction to Hadoop
• Components of Hadoop Ecosystem
• Big Data Analytics Introduction
MODULE 2: HDFS AND MAP REDUCE
• HDFS – Big Data Storage
• Distributed Processing with Map Reduce
• Mapping and reducing stages concepts
• Key Terms: Output Format, Partitioners, Combiners, Shuffle, and Sort
MODULE 3: PYSPARK FOUNDATION
• PySpark Introduction
• Spark Configuration
• Resilient distributed datasets (RDD)
• Working with RDDs in PySpark
• Aggregating Data with Pair RDDs
MODULE 4: SPARK SQL and HADOOP HIVE
• Introducing Spark SQL
• Spark SQL vs Hadoop Hive
MODULE 1: TABLEAU FUNDAMENTALS
• Introduction to Business Intelligence & Introduction to Tableau
• Interface Tour, Data visualization: Pie chart, Column chart, Bar chart.
• Bar chart, Tree Map, Line Chart
• Area chart, Combination Charts, Map
• Dashboards creation, Quick Filters
• Create Table Calculations
• Create Calculated Fields
• Create Custom Hierarchies
MODULE 2: POWER-BI BASICS
• Power BI Introduction
• Basics Visualizations
• Dashboard Creation
• Basic Data Cleaning
• Basic DAX FUNCTION
MODULE 3: DATA TRANSFORMATION TECHNIQUES
• Exploring Query Editor
• Data Cleansing and Manipulation:
• Creating Our Initial Project File
• Connecting to Our Data Source
• Editing Rows
• Changing Data Types
• Replacing Values
MODULE 4: CONNECTING TO VARIOUS DATA SOURCES
• Connecting to a CSV File
• Connecting to a Webpage
• Extracting Characters
• Splitting and Merging Columns
• Creating Conditional Columns
• Creating Columns from Examples
• Create Data Model
I joined DataMites for the Certified Data Scientist online course, and it was a great experience! The real-time projects helped me apply my learning practically, and the placement support added real value to my career restart after 8 years. DataMites is the perfect platform to learn, grow, and begin your data science journey.
I joined DataMites for the Data Science course and learned Python, SQL, Machine Learning, and Deep Learning through hands-on projects. The trainers are excellent at explaining concepts clearly. The placement team is very supportive and provides great opportunities thanks to DataMites for helping me start my data science journey.
I joined DataMites after my B.Tech when I developed an interest in Data Science and Machine Learning. The training was well-structured, and I even got an internship opportunity that helped me gain real experience. The placement team was super supportive and guided me through every step. Thanks to DataMites, I’m now placed at Horizon Broadband Pvt. Ltd.
I joined DataMites after completing my BCA, and it was the best decision for my data science career! I learned Python, SQL, Machine Learning, Deep Learning, and NLP, and worked on several capstone and client projects that gave me real-world experience. The trainers and team were always friendly and supportive, patiently clearing all my doubts. Thanks to DataMites, I’m confident and job-ready in data science
I started my data science journey with DataMites, and it’s been an amazing experience! The Certified Data Scientist Program helped me learn everything from scratch through hands-on projects and an internship. The placement team was incredibly supportive, always ready to clarify my doubts. Thanks to their guidance, I successfully got placed. Highly recommend DataMites to anyone starting their data science career
Enrolling at DataMites was one of the best decisions I made for my career. Coming from a freelance writing background with no prior technical experience, I was initially unsure about stepping into the field of data analytics. But DataMites made the transition smooth and achievable. I’d highly recommend them to anyone looking for a guided, industry-ready data analytics course. A true DataMites success story!
After completing a Data Analyst course, professionals can work as Data Analyst, Business Analyst, Reporting Analyst, MIS Executive, Data Consultant, or Junior Data Scientist. These roles span IT, BFSI, healthcare, e-commerce, and government-driven digital projects.
Varanasi offers affordable education, growing digital adoption, and access to online-first job markets. With remote hiring and regional business digitization, students can build analytics careers while benefiting from lower living costs and reputed training institutes.
A Data Analyst course typically lasts 4–8 months, depending on learning mode. Fast-track programs take 3–4 months, while comprehensive programs with projects, internships, and placement support may extend up to 8 months.
The cost ranges from ₹40,000 to ₹1,20,000, based on curriculum depth, tools covered, certifications, and placement assistance. Institutes offering live projects, mentorship, and industry-recognized certification may charge slightly higher fees.
Look for institutes with industry-aligned syllabus, experienced trainers, real-time projects, recognized certification, transparent placement records, and positive alumni reviews. Demo classes, curriculum comparison, and tool coverage (SQL, Python, BI) are key checks.
India has strong demand for Data Analysts due to digital transformation, AI adoption, and data-driven decision-making. Sectors like IT, finance, healthcare, retail, and startups consistently hire analysts, making it one of the most in-demand tech careers.
In Uttar Pradesh, entry-level Data Analysts earn ₹3–6 LPA, while experienced professionals earn ₹7–12 LPA. Salaries increase with skills in SQL, Python, Power BI, cloud analytics, and experience with real business datasets.
Key tools include Excel, SQL, Python/R, Power BI, Tableau, Google Sheets, and basic statistics tools. Analysts also use databases, data visualization platforms, and sometimes cloud tools like BigQuery or Azure for scalable data analysis.
A Data Analyst can pursue roles such as Data Analyst, Business Intelligence Analyst, Reporting Analyst, Operations Analyst, Product Analyst, Marketing Analyst, or Analytics Consultant across IT services, corporates, startups, and government projects.
Yes. Data Analytics is suitable for non-technical backgrounds like commerce, arts, or science. With structured training in Excel, SQL, and visualization tools, learners can transition into analytics without deep programming or engineering experience
SQL is critical for extracting, filtering, and analyzing data from databases. Data Analysts use SQL daily to query large datasets, create reports, and support business decisions, making it one of the most essential and employer-required skills.
Data Analytics focuses on analyzing historical data for insights and reporting, while Data Science includes advanced modeling, machine learning, and predictive algorithms. Analytics is more business-oriented; Data Science is more research and AI-focused.
Yes, many institutes offer part-time, weekend, and online Data Analytics courses. These formats are ideal for students, working professionals, and career switchers, allowing flexible learning without compromising job or academic commitments.
The syllabus includes Excel, statistics, SQL, Python/R basics, data cleaning, data visualization (Power BI/Tableau), business analytics, real-time projects, case studies, and sometimes cloud analytics and interview preparation modules.
The scope is excellent due to India’s expanding digital economy. With data-driven governance, startups, IT services, and global outsourcing growth, Data Analysts enjoy long-term career stability, cross-industry demand, and global opportunities.
Key skills include Excel, SQL, data visualization, basic Python/R, statistics, data cleaning, and analytical thinking. Knowledge of Power BI or Tableau and business understanding significantly improves employability and career growth.
Data Analysts work on sales analysis, customer behavior studies, financial reporting, marketing performance dashboards, operational efficiency analysis, and forecasting projects using real-world datasets to support business decision-making.
Yes. Excel remains essential for data cleaning, quick analysis, pivot tables, dashboards, and reporting. Many organizations still rely heavily on Excel alongside advanced tools, making it a foundational skill for every Data Analyst.
Basic programming knowledge is helpful but not mandatory. SQL and Excel are more critical initially. Learning Python later enhances automation and analysis depth, but many entry-level roles focus on querying, reporting, and visualization skills.
Top recruiters include TCS, Infosys, Wipro, HCL, Tech Mahindra, Accenture, regional IT firms, fintech startups, healthcare analytics companies, and government digital initiatives across Noida, Lucknow, and nearby tech hubs.
DataMites stands out due to its industry-aligned curriculum, IABAC certification, expert trainers, live projects, and strong career support. With proven training standards and learner success across India, it offers trusted, job-oriented data analytics education in Varanasi.
Yes, DataMites offers internship opportunities as part of the Certified Data Analyst Course. Learners gain real-world exposure through practical assignments and industry-oriented internships that help build hands-on experience and strengthen job readiness.
Yes, DataMites provides flexible EMI options to make learning affordable. Students can pay the course fee in easy monthly installments through approved financial partners, ensuring accessibility without compromising on quality training.
The course fee vary based on learning mode online INR 61,135, blended INR 38,477, or classroom INR 66,647. DataMites offers competitive pricing with flexible payment plans. For accurate and updated fee details, learners are advised to connect with the DataMites Varanasi counseling team.
Yes, DataMites provides placement assistance including resume building, interview preparation, and job referrals. With strong industry connections and a dedicated career support team, learners are guided toward relevant data analyst job opportunities.
DataMites follows a transparent refund policy based on the enrollment stage and course commencement. Refund eligibility is clearly communicated during registration, ensuring fairness and trust. Learners can review detailed terms before confirming enrollment.
Students receive comprehensive study materials including LMS access, recorded sessions, practice datasets, project guides, and assessments. These resources are designed by industry experts to support effective learning and long-term skill development.
Courses are delivered by experienced industry professionals and certified trainers with strong analytics backgrounds. Instructors bring real-world expertise, ensuring learners gain practical insights aligned with current data analytics industry demands.
Yes, DataMites includes multiple live and capstone projects in the course. These projects simulate real business scenarios, helping learners apply analytical tools, gain hands-on experience, and build a strong professional portfolio.
The course duration typically ranges from 6 months, depending on the learning mode. It includes instructor-led training, practical sessions, projects, and assessments, ensuring a balanced and in-depth learning experience.
Yes, DataMites offers recorded sessions and flexible batch options. Learners can revisit missed classes through LMS access or attend alternative sessions, ensuring uninterrupted learning and concept clarity.
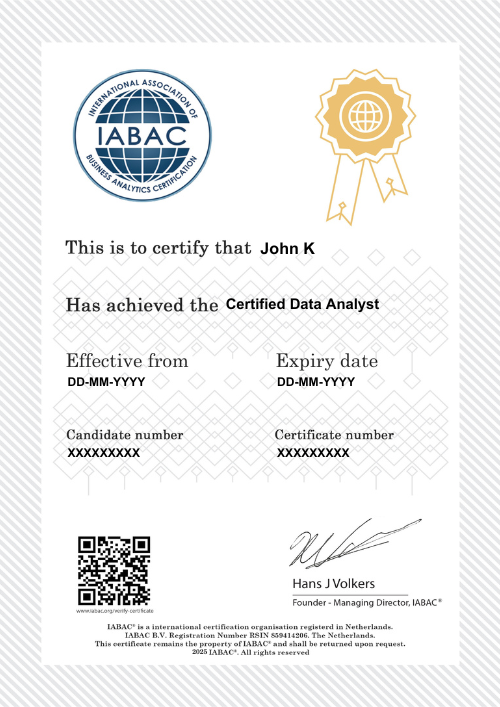
Learners receive the globally recognized IABAC® Certified Data Analyst certification. Additional project and internship certificates may also be provided, enhancing professional credibility and employability in the analytics domain.
DataMites Flexi Pass allows learners to attend multiple batches and sessions across schedules. This flexible learning feature helps students revise concepts, manage time better, and complete the course at their own pace.
Yes, DataMites offers a free demo session to help learners understand course structure, teaching methodology, and trainer expertise. This ensures informed decision-making before enrollment.
DataMites accepts multiple payment options including UPI, credit/debit cards, net banking, and EMI plans. These secure and flexible methods ensure a smooth and convenient enrollment process.
The DataMites Placement Assistance Team(PAT) facilitates the aspirants in taking all the necessary steps in starting their career in Data Science. Some of the services provided by PAT are: -
The DataMites Placement Assistance Team(PAT) conducts sessions on career mentoring for the aspirants with a view of helping them realize the purpose they have to serve when they step into the corporate world. The students are guided by industry experts about the various possibilities in the Data Science career, this will help the aspirants to draw a clear picture of the career options available. Also, they will be made knowledgeable about the various obstacles they are likely to face as a fresher in the field, and how they can tackle.
No, PAT does not promise a job, but it helps the aspirants to build the required potential needed in landing a career. The aspirants can capitalize on the acquired skills, in the long run, to a successful career in Data Science.