110,000
64,191*
NO COST EMI : 10,699 p.m for 6 Months
*Offer valid till 31st July 2026
Instructor Led Live Online
Self Learning + Live Mentoring
In - Person Classroom Training


MODULE 1: DATA ANALYSIS FOUNDATION
• Data Analysis Introduction
• Data Preparation for Analysis
• Common Data Problems
• Various Tools for Data Analysis
• Evolution of Analytics domain
MODULE 2: CLASSIFICATION OF ANALYTICS
• Four types of the Analytics
• Descriptive Analytics
• Diagnostics Analytics
• Predictive Analytics
• Prescriptive Analytics
• Human Input in Various type of Analytics
MODULE 3: CRIP-DM Model
• Introduction to CRIP-DM Model
• Business Understanding
• Data Understanding
• Data Preparation
• Modeling, Evaluation, Deploying,Monitoring
MODULE 4: UNIVARIATE DATA ANALYSIS
• Summary statistics -Determines the value’s center and spread.
• Measure of Central Tendencies: Mean, Median and Mode
• Measures of Variability: Range, Interquartile range, Variance and Standard Deviation
• Frequency table -This shows how frequently various values occur.
• Charts -A visual representation of the distribution of values.
MODULE 5: DATA ANALYSIS WITH VISUAL CHARTS
• Line Chart
• Column/Bar Chart
• Waterfall Chart
• Tree Map Chart
• Box Plot
MODULE 6: BI-VARIATE DATA ANALYSIS
• Scatter Plots
• Regression Analysis
• Correlation Coefficients
MODULE 1: PYTHON BASICS
• Introduction of python
• Installation of Python and IDE
• Python Variables
• Python basic data types
• Number & Booleans, strings
• Arithmetic Operators
• Comparison Operators
• Assignment Operators
MODULE 2: PYTHON CONTROL STATEMENTS
• IF Conditional statement
• IF-ELSE
• NESTED IF
• Python Loops basics
• WHILE Statement
• FOR statements
• BREAK and CONTINUE statements
MODULE 3: PYTHON DATA STRUCTURES
• Basic data structure in python
• Basics of List
• List: Object, methods
• Tuple: Object, methods
• Sets: Object, methods
• Dictionary: Object, methods
MODULE 4: PYTHON FUNCTIONS
• Functions basics
• Function Parameter passing
• Lambda functions
• Map, reduce, filter functions
MODULE 1 : OVERVIEW OF STATISTICS
MODULE 2 : HARNESSING DATA
MODULE 3 : EXPLORATORY DATA ANALYSIS
MODULE 4 : HYPOTHESIS TESTING
MODULE 1: COMPARISION AND CORRELATION ANALYSIS
• Data comparison Introduction,
• Performing Comparison Analysis on Data
• Concept of Correlation
• Calculating Correlation with Excel
• Comparison vs Correlation
• Hands-on case study : Comparison Analysis
• Hands-on case study Correlation Analysis
MODULE 2: VARIANCE AND FREQUENCY ANALYSIS
• Variance Analysis Introduction
• Data Preparation for Variance Analysis
• Performing Variance and Frequency Analysis
• Business use cases for Variance Analysis
• Business use cases for Frequency Analysis
MODULE 3: RANKING ANALYSIS
• Introduction to Ranking Analysis
• Data Preparation for Ranking Analysis
• Performing Ranking Analysis with Excel
• Insights for Ranking Analysis
• Hands-on Case Study: Ranking Analysis
MODULE 4: BREAK EVEN ANALYSIS
• Concept of Breakeven Analysis
• Make or Buy Decision with Break Even
• Preparing Data for Breakeven Analysis
• Hands-on Case Study: Manufacturing
MODULE 5: PARETO (80/20 RULE) ANALSYSIS
• Pareto rule Introduction
• Preparation Data for Pareto Analysis,
• Performing Pareto Analysis on Data
• Insights on Optimizing Operations with Pareto Analysis
• Hands-on case study: Pareto Analysis
MODULE 6: Time Series and Trend Analysis
• Introduction to Time Series Data
• Preparing data for Time Series Analysis
• Types of Trends
• Trend Analysis of the Data with Excel
• Insights from Trend Analysis
MODULE 7: DATA ANALYSIS BUSINESS REPORTING
• Management Information System Introduction
• Various Data Reporting formats
• Creating Data Analysis reports as per the requirements
MODULE 1: DATA ANALYTICS FOUNDATION
• Business Analytics Overview
• Application of Business Analytics
• Benefits of Business Analytics
• Challenges
• Data Sources
• Data Reliability and Validity
MODULE 2: OPTIMIZATION MODELS
• Predictive Analytics with Low Uncertainty;Case Study
• Mathematical Modeling and Decision Modeling
• Product Pricing with Prescriptive Modeling
• Assignment 1 : KERC Inc, Optimum Manufacturing Quantity
MODULE 3: PREDICTIVE ANALYTICS WITH REGRESSION
• Mathematics behind Linear Regression
• Case Study : Sales Promotion Decision with Regression Analysis
• Hands on Regression Modeling in Excel
MODULE 4: DECISION MODELING
• Predictive Analytics with High Uncertainty
• Case Study-Monte Carlo Simulation
• Comparing Decisions in Uncertain Settings
• Trees for Decision Modeling
• Case Study : Supplier Decision Modeling - Kickathlon Sports Retailer
MODULE 1: MACHINE LEARNING INTRODUCTION
• What Is ML? ML Vs AI
• ML Workflow, Popular ML Algorithms
• Clustering, Classification And Regression
• Supervised Vs Unsupervised
MODULE 2: ML ALGO: LINEAR REGRESSSION
• Introduction to Linear Regression
• How it works: Regression and Best Fit Line
• Hands-on Linear Regression with ML Tool
MODULE 3: ML ALGO: LOGISTIC REGRESSION
• Introduction to Logistic Regression;
• Classification & Sigmoid Curve
• Hands-on Logistics Regression with ML Tool
MODULE 4: ML ALGO: KNN
• Introduction to KNN; Nearest Neighbor
• Regression with KNN
• Hands-on: KNN with ML Tool
MODULE 5: ML ALGO: K MEANS CLUSTERING
• Understanding Clustering (Unsupervised)
• Introduction to KMeans and How it works
• Hands-on: K Means Clustering
MODULE 6: ML ALGO: DECISION TREE
• Decision Tree and How it works
• Hands-on: Decision Tree with ML Tool
MODULE 7: ML ALGO: SUPPORT VECTOR MACHINE (SVM)
• Introduction to SVM
• How It Works: SVM Concept, Kernel Trick
• Hands-on: SVM with ML Tool
MODULE 8: ARTIFICIAL NEURAL NETWORK (ANN)
• Introduction to ANN, How It Works
• Back propagation, Gradient Descent
• Hands-on: ANN with ML Tool
MODULE 1: DATABASE INTRODUCTION
• DATABASE Overview
• Key concepts of database management
• CRUD Operations
• Relational Database Management System
• RDBMS vs No-SQL (Document DB)
MODULE 2: SQL BASICS
• Introduction to Databases
• Introduction to SQL
• SQL Commands
• MY SQL workbench installation
MODULE 3: DATA TYPES AND CONSTRAINTS
• Numeric, Character, date time data type
• Primary key, Foreign key, Not null
• Unique, Check, default, Auto increment
MODULE 4: DATABASES AND TABLES (MySQL)
• Create database
• Delete database
• Show and use databases
• Create table, Rename table
• Delete table, Delete table records
• Create new table from existing data types
• Insert into, Update records
• Alter table
MODULE 5: SQL JOINS
• Inner join, Outer Join
• Left join, Right Join
• Self Join, Cross join
• Windows Functions: Over, Partition, Rank
MODULE 6: SQL COMMANDS AND CLAUSES
• Select, Select distinct
• Aliases, Where clause
• Relational operators, Logical
• Between, Order by, In
• Like, Limit, null/not null, group by
• Having, Sub queries
MODULE 7: DOCUMENT DB/NO-SQL DB
• Introduction of Document DB
• Document DB vs SQL DB
• Popular Document DBs
• MongoDB basics
• Data format and Key methods
• MongoDB data management
MODULE 1: BIG DATA INTRODUCTION
• Big Data Overview
• Five Vs of Big Data
• What is Big Data and Hadoop
• Introduction to Hadoop
• Components of Hadoop Ecosystem
• Big Data Analytics Introduction
MODULE 2: HDFS AND MAP REDUCE
• HDFS – Big Data Storage
• Distributed Processing with Map Reduce
• Mapping and reducing stages concepts
• Key Terms: Output Format, Partitioners, Combiners, Shuffle, and Sort
MODULE 3: PYSPARK FOUNDATION
• PySpark Introduction
• Spark Configuration
• Resilient distributed datasets (RDD)
• Working with RDDs in PySpark
• Aggregating Data with Pair RDDs
MODULE 4: SPARK SQL and HADOOP HIVE
• Introducing Spark SQL
• Spark SQL vs Hadoop Hive
MODULE 1: TABLEAU FUNDAMENTALS
• Introduction to Business Intelligence & Introduction to Tableau
• Interface Tour, Data visualization: Pie chart, Column chart, Bar chart.
• Bar chart, Tree Map, Line Chart
• Area chart, Combination Charts, Map
• Dashboards creation, Quick Filters
• Create Table Calculations
• Create Calculated Fields
• Create Custom Hierarchies
MODULE 2: POWER-BI BASICS
• Power BI Introduction
• Basics Visualizations
• Dashboard Creation
• Basic Data Cleaning
• Basic DAX FUNCTION
MODULE 3: DATA TRANSFORMATION TECHNIQUES
• Exploring Query Editor
• Data Cleansing and Manipulation:
• Creating Our Initial Project File
• Connecting to Our Data Source
• Editing Rows
• Changing Data Types
• Replacing Values
MODULE 4: CONNECTING TO VARIOUS DATA SOURCES
• Connecting to a CSV File
• Connecting to a Webpage
• Extracting Characters
• Splitting and Merging Columns
• Creating Conditional Columns
• Creating Columns from Examples
• Create Data Model
AI is the future, and DataMites helped me step into it! The online Data Science course was easy to follow, and the tutors explained everything clearly. Even after completing my course, the team supported me with placements and I successfully cracked a job! Grateful to DataMites for shaping my career.
I joined DataMites to learn Data Science and gained strong skills in ML, DL, and Statistics. Through my internship at Rubixe AI Solutions, I worked on real-world projects, which helped me land job interviews and an offer. The trainers were very supportive and explained every concept clearly. Thanks to DataMites, my data science journey was smooth and successful.
My mentor, a DataMites alumnus, suggested I join the Data Science course, and it was one of my best decisions! The offline classes were interactive and full of guidance, and I got the chance to intern at Rubixe AI Solutions. The placement team was very supportive and helped me perfect my resume. Truly thankful to DataMites for this amazing learning journey.
I joined DataMites after completing my engineering in Computer Science and became a Certified Data Scientist. With their support, I completed an internship at Rubix AI Solutions and now work as an AI intern at Inventor Hub. DataMites made learning statistics and data science easy with clear guidance and great materials. I’m truly thankful for their support.
I joined DataMites for the Certified Data Scientist online course, and it was a great experience! The real-time projects helped me apply my learning practically, and the placement support added real value to my career restart after 8 years. DataMites is the perfect platform to learn, grow, and begin your data science journey.
I joined DataMites for the Data Science course and learned Python, SQL, Machine Learning, and Deep Learning through hands-on projects. The trainers are excellent at explaining concepts clearly. The placement team is very supportive and provides great opportunities thanks to DataMites for helping me start my data science journey.
I joined DataMites after my B.Tech when I developed an interest in Data Science and Machine Learning. The training was well-structured, and I even got an internship opportunity that helped me gain real experience. The placement team was super supportive and guided me through every step. Thanks to DataMites, I’m now placed at Horizon Broadband Pvt. Ltd.
I joined DataMites after completing my BCA, and it was the best decision for my data science career! I learned Python, SQL, Machine Learning, Deep Learning, and NLP, and worked on several capstone and client projects that gave me real-world experience. The trainers and team were always friendly and supportive, patiently clearing all my doubts. Thanks to DataMites, I’m confident and job-ready in data science
I started my data science journey with DataMites, and it’s been an amazing experience! The Certified Data Scientist Program helped me learn everything from scratch through hands-on projects and an internship. The placement team was incredibly supportive, always ready to clarify my doubts. Thanks to their guidance, I successfully got placed. Highly recommend DataMites to anyone starting their data science career
Enrolling at DataMites was one of the best decisions I made for my career. Coming from a freelance writing background with no prior technical experience, I was initially unsure about stepping into the field of data analytics. But DataMites made the transition smooth and achievable. I’d highly recommend them to anyone looking for a guided, industry-ready data analytics course. A true DataMites success story!
A data analytics course in Perungudi helps you gain valuable skills in data interpretation, visualization, and decision-making. It enhances career opportunities by providing practical knowledge aligned with industry needs. Convenient location and expert training make it a great choice for professionals and students.
The duration of a Data Analytics course in Perungudi generally ranges from 4 to 12 months, depending on the institution and curriculum. Flexible learning options, such as part-time and weekend classes, are available. The timeline may vary based on course content and hands-on project involvement.
The cost of a data analytics course in Perungudi typically falls between INR 30,000 and INR 1,20,000. This variation is influenced by the course duration and the type of certification provided. Courses offering extra support or more advanced content are usually priced at the higher end.
Anyone interested in pursuing a career in data analytics can enroll in the course at the Perungudi branch. The program is open to individuals from various backgrounds, including beginners and professionals seeking to enhance their skills. It is designed to cater to a wide range of learning needs and career goals.
To succeed in data analytics courses, a strong foundation in mathematics and statistics is crucial. Proficiency in programming languages like Python or R enhances data manipulation and analysis. Additionally, critical thinking and problem-solving skills are essential to interpret complex datasets effectively.
Yes, offline data analytics courses are available at the Perungudi branch, located at 2nd Floor, IndiQube Brigade Vantage, Sy. No. 284/21B, Santhosh Nagar, Karunanidhi Nagar, Perungudi, Chennai, Tamil Nadu 600096. Individuals from nearby areas such as Kandhanchavadi (600096), Thiruvanmiyur (600041), Ambedkar Nagar (600032), Annai Sandhiya Nagar (600081), Lakshmi Nagar (600096), Kandhanchavadi (600096), Thuraipakkam (600097), Velachery (600042), Ram Nagar (600091), Palavakkam (600041), Natco Colony (600041), OMR (600119), Neelankarai (600041), Thoraipakkam (600097), Kaiveli (600042), Additionally, Perungudi itself, including Karunanidhi Nagar (600096) can also enroll. The center offers hands-on training in a professional environment, ideal for gaining practical experience.
There are several institutes offering data analytics courses in Perungudi. Among them, DataMites stands out as one of the top choices, known for its comprehensive curriculum and hands-on training. It offers a strong foundation for those looking to pursue a career in data analytics.
Common tools used in data analytics include Excel, Tableau, and Power BI for data visualization, while Python and R are frequently utilized for data manipulation and statistical analysis. SQL is essential for querying databases. These tools help streamline data collection, analysis, and presentation for informed decision-making.
Key techniques in data analytics include statistical analysis to identify trends, machine learning for predictive modeling, and data visualization to communicate insights. Data cleaning and preprocessing are essential steps for accurate analysis. These methods help uncover patterns, drive decision-making, and enhance business strategies.
Yes, data analytics roles in Chennai continue to be in high demand. The city's growing tech industry and the increasing reliance on data-driven decision-making contribute to this trend. Professionals with expertise in data analysis are sought after across various sectors in Chennai.
Data Analysts in Chennai can expect salaries ranging from approximately INR 5 Lakhs to INR 16 Lakhs per year, with an average annual salary around INR 10 Lakhs. Salaries can vary based on experience, skills, and the hiring company, with entry-level roles typically falling on the lower end of this range.
Yes, a non-engineering graduate can transition into data analytics by acquiring the necessary skills in areas like statistics, programming, and data visualization. Online courses, boot camps, and certifications can help bridge the knowledge gap. Practical experience through projects or internships can further strengthen their transition.
Several leading companies in Chennai are actively seeking data analysts. Notable employers include Tata Consultancy Services, NielsenIQ, and Comcast Corporation. These organizations offer diverse opportunities for professionals in the data analytics field.
Chennai's data analytics sector is expanding rapidly, offering diverse career opportunities across industries like IT, healthcare, and finance. The city's growing demand for data-driven decision-making is expected to continue, providing professionals with promising prospects. By 2025, Chennai is projected to be a key player in the data analytics field, making it an attractive career choice for those seeking growth and stability.
Data analytics focuses on examining historical data to identify trends and insights for decision-making. Data science, on the other hand, combines advanced statistical methods, machine learning, and algorithms to predict future outcomes. While analytics is descriptive, data science is more about building predictive models and finding deeper patterns.
In Chennai, data analytics professionals engage in roles such as data analysts, data scientists, and business analysts. These positions involve collecting, cleaning, and interpreting data to inform business decisions. Proficiency in tools like SQL, Python, and data visualization software is often required.
Studying data analytics helps in making informed decisions by transforming raw data into valuable insights. It enables organizations to identify trends, optimize operations, and predict future outcomes. Mastering this skill is essential in today’s data-driven world for enhancing business strategies and efficiency.
To become a data analyst in Chennai, one should gain proficiency in data analysis tools such as Excel, SQL, and Python. Acquiring relevant certifications and a strong understanding of statistics will be beneficial. Practical experience through internships or projects can further enhance your qualifications.
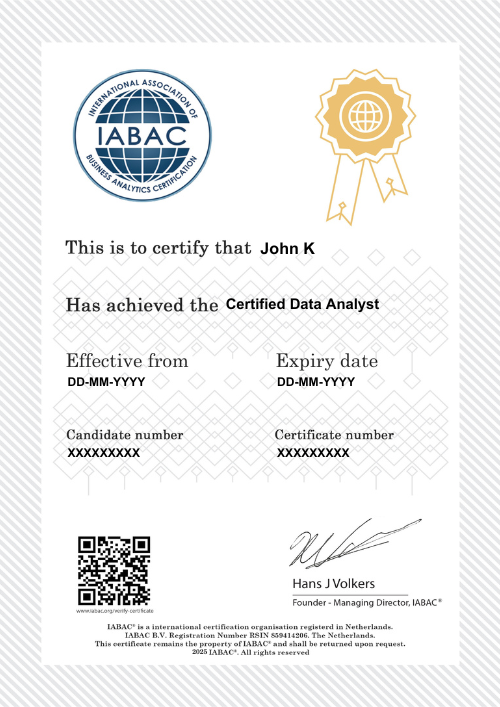
A Certified Data Analyst course provides essential training in analyzing and interpreting data using statistical tools and techniques. It equips individuals with skills to handle, process, and visualize data effectively. Completing this course typically leads to certification, validating one's expertise in data analysis.
Data analytics involves examining raw data to uncover patterns, trends, and insights. It helps organizations make informed decisions by transforming data into actionable knowledge. By analyzing data, businesses can optimize performance and predict future outcomes.
To enroll in the DataMites Data Analytics course in Perungudi, visit our website and complete the registration form. Alternatively, get in touch with our educational counselor for personalized assistance. We’re here to help you every step of the way.
DataMites offers Data Analytics courses at their Perungudi center in Chennai. While specific information about EMI (Equated Monthly Installment) options is not detailed in the available sources, DataMites provides various payment methods, including cash, credit card, PayPal, American Express, net banking, cheque, debit card, Visa, and MasterCard. For detailed information on EMI options, it is advisable to contact DataMites directly.
The fees for Data Analytics courses in Perungudi generally range from INR 10,000 to INR 1,20,000. At the DataMites Perungudi branch, the fee structure falls between INR 40,000 and INR 80,000. The Certified Data Analyst Program, an 8-month course, is priced at INR 55,451 for online, INR 60,451 for offline, and INR 34,900 for blended learning.
DataMites Perungudi offers Data Analytics courses that provide practical exposure through live projects. These hands-on experiences enable students to apply their knowledge in real-world contexts. The courses are crafted to strengthen both theoretical understanding and practical expertise in data analytics. For more details, kindly visit our official website.
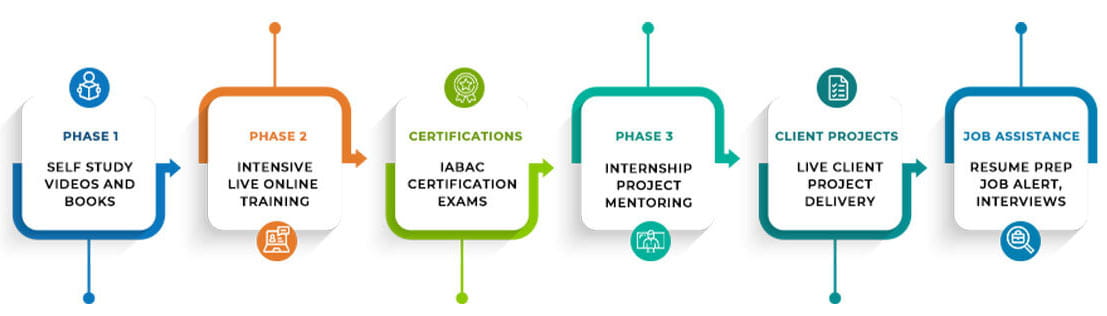
Yes, the DataMites Data Analytics course includes internship opportunities as part of its program. These internships provide hands-on experience to help students apply their learning in real-world settings. Students are supported in securing relevant internships through the course.
When you enroll in the Data Analytics course at Perungudi, you'll be provided with a complete set of learning materials, such as course books, online resources, and practice datasets. You'll also have access to recorded lectures, hands-on projects, and ongoing support throughout the course. Moreover, you'll receive guidance on industry-standard tools and techniques.
DataMites offers a 100% refund if you request cancellation within one week of the batch start date and have attended at least two training sessions during that week. Refunds are processed within 5 to 7 working days from the date of the email request. Please note that no refunds will be issued after six months from the course enrollment date.
The Data Analytics course at DataMites in Perungudi offers a comprehensive curriculum designed to provide hands-on experience with real-world data. It is led by experienced trainers who ensure that students develop practical and analytical skills. Additionally, the course provides flexible learning options, catering to both beginners and professionals.
Yes, DataMites in Perungudi offers a Data Analytics course with placement assistance. The program is designed to help students gain essential skills in data analytics. Placement opportunities are available, but they are influenced by individual performance and market conditions.
DataMites operates three offline centers in Chennai, each strategically located to serve aspiring data scientists:
These centers provide a diverse learning environment for those looking to advance their data science careers.
DataMites in Perungudi offers free demo classes for their data analytics programs. These sessions provide an overview of the course content and teaching methodology. To register for a demo class, please visit our official website.
The DataMites branch in Perungudi is located at:
2nd Floor, IndiQube Brigade Vantage, Sy. No. 284/21B, Santhosh Nagar, Karunanidhi Nagar, Perungudi, Chennai, Tamil Nadu 600096.
This address is easily accessible within the Perungudi area of Chennai.
If you miss a session at DataMites, you can easily catch up by viewing the recorded class. All online sessions are recorded and made available to participants. This ensures you can learn at your own pace, without missing out on any content.
DataMites offers certifications in data science, AI, and analytics, recognized by IABAC® and NASSCOM® FutureSkills. These certifications are designed to enhance your skills and boost career prospects in emerging technologies. The programs provide practical knowledge and industry relevance for professional growth.
At DataMites, the instructors are skilled professionals with strong academic backgrounds and industry certifications. Ashok Veda, CEO of Rubixe, serves as the head trainer. The team combines theoretical knowledge with hands-on experience to provide practical training in data science and analytics.
The DataMites Placement Assistance Team(PAT) facilitates the aspirants in taking all the necessary steps in starting their career in Data Science. Some of the services provided by PAT are: -
The DataMites Placement Assistance Team(PAT) conducts sessions on career mentoring for the aspirants with a view of helping them realize the purpose they have to serve when they step into the corporate world. The students are guided by industry experts about the various possibilities in the Data Science career, this will help the aspirants to draw a clear picture of the career options available. Also, they will be made knowledgeable about the various obstacles they are likely to face as a fresher in the field, and how they can tackle.
No, PAT does not promise a job, but it helps the aspirants to build the required potential needed in landing a career. The aspirants can capitalize on the acquired skills, in the long run, to a successful career in Data Science.