 4.9 (17,540) reviews
 C 3,050
C 2,117*
*Offer valid till 11th October 2026
Instructor Led Live Online
Self Learning + Live Mentoring
Customize Your Training
MODULE 1: DATA SCIENCE ESSENTIALS
• Introduction to Data Science
• Evolution of Data Science
• Big Data Vs Data Science
• Data Science Terminologies
• Data Science vs AI/Machine Learning
• Data Science vs Analytics
MODULE 2: DATA SCIENCE DEMO
• Business Requirement: Use Case
• Data Preparation
• Machine learning Model building
• Prediction with ML model
• Delivering Business Value.
MODULE 3: ANALYTICS CLASSIFICATION
• Types of Analytics
• Descriptive Analytics
• Diagnostic Analytics
• Predictive Analytics
• Prescriptive Analytics
• EDA and insight gathering demo in Tableau
MODULE 4: DATA SCIENCE AND RELATED FIELDS
• Introduction to AI
• Introduction to Computer Vision
• Introduction to Natural Language Processing
• Introduction to Reinforcement Learning
• Introduction to GAN
• Introduction to Generative Passive Models
MODULE 5: DATA SCIENCE ROLES & WORKFLOW
• Data Science Project workflow
• Roles: Data Engineer, Data Scientist, ML Engineer and MLOps Engineer
• Data Science Project stages.
MODULE 6: MACHINE LEARNING INTRODUCTION
• What Is ML? ML Vs AI
• ML Workflow, Popular ML Algorithms
• Clustering, Classification And Regression
• Supervised Vs Unsupervised
MODULE 7: DATA SCIENCE INDUSTRY APPLICATIONS
• Data Science in Finance and Banking
• Data Science in Retail
• Data Science in Health Care
• Data Science in Logistics and Supply Chain
• Data Science in Technology Industry
• Data Science in Manufacturing
• Data Science in Agriculture
MODULE 1: PYTHON BASICS
• Introduction of python
• Installation of Python and IDE
• Python Variables
• Python basic data types
• Number & Booleans, strings
• Arithmetic Operators
• Comparison Operators
• Assignment Operators
MODULE 2: PYTHON CONTROL STATEMENTS
• IF Conditional statement
• IF-ELSE
• NESTED IF
• Python Loops basics
• WHILE Statement
• FOR statements
• BREAK and CONTINUE statements
MODULE 3: PYTHON DATA STRUCTURES
• Basic data structure in python
• Basics of List
• List: Object, methods
• Tuple: Object, methods
• Sets: Object, methods
• Dictionary: Object, methods
MODULE 4: PYTHON FUNCTIONS
• Functions basics
• Function Parameter passing
• Lambda functions
• Map, reduce, filter functions
MODULE 1: OVERVIEW OF STATISTICS
• Introduction to Statistics
• Descriptive And Inferential Statistics
• Basic Terms Of Statistics
• Types Of Data
MODULE 2: HARNESSING DATA
• Random Sampling
• Sampling With Replacement And Without Replacement
• Cochran's Minimum Sample Size
• Types of Sampling
• Simple Random Sampling
• Stratified Random Sampling
• Cluster Random Sampling
• Systematic Random Sampling
• Multi stage Sampling
• Sampling Error
• Methods Of Collecting Data
MODULE 3: EXPLORATORY DATA ANALYSIS
• Exploratory Data Analysis Introduction
• Measures Of Central Tendencies: Mean,Median And Mode
• Measures Of Central Tendencies: Range, Variance And Standard Deviation
• Data Distribution Plot: Histogram
• Normal Distribution & Properties
• Z Value / Standard Value
• Empirical Rule and Outliers
• Central Limit Theorem
• Normality Testing
• Skewness & Kurtosis
• Measures Of Distance: Euclidean, Manhattan And Minkowski Distance
• Covariance & Correlation
MODULE 4: HYPOTHESIS TESTING
• Hypothesis Testing Introduction
• P- Value, Critical Region
• Types of Hypothesis Testing
• Hypothesis Testing Errors : Type I And Type II
• Two Sample Independent T-test
• Two Sample Relation T-test
• One Way Anova Test
• Application of Hypothesis testing
MODULE 1: MACHINE LEARNING INTRODUCTION
• What Is ML? ML Vs AI
• Clustering, Classification And Regression
• Supervised Vs Unsupervised
MODULE 2: PYTHON NUMPY PACKAGE
• Introduction to Numpy Package
• Array as Data Structure
• Core Numpy functions
• Matrix Operations, Broadcasting in Arrays
MODULE 3: PYTHON PANDAS PACKAGE
• Introduction to Pandas package
• Series in Pandas
• Data Frame in Pandas
• File Reading in Pandas
• Data munging with Pandas
MODULE 4: VISUALIZATION WITH PYTHON - Matplotlib
• Visualization Packages (Matplotlib)
• Components Of A Plot, Sub-Plots
• Basic Plots: Line, Bar, Pie, Scatter
MODULE 5: PYTHON VISUALIZATION PACKAGE - SEABORN
• Seaborn: Basic Plot
• Advanced Python Data Visualizations
MODULE 6: ML ALGO: LINEAR REGRESSSION
• Introduction to Linear Regression
• How it works: Regression and Best Fit Line
• Modeling and Evaluation in Python
MODULE 7: ML ALGO: LOGISTIC REGRESSION
• Introduction to Logistic Regression
• How it works: Classification & Sigmoid Curve
• Modeling and Evaluation in Python
MODULE 8: ML ALGO: K MEANS CLUSTERING
• Understanding Clustering (Unsupervised)
• K Means Algorithm
• How it works : K Means theory
• Modeling in Python
MODULE 9: ML ALGO: KNN
• Introduction to KNN
• How It Works: Nearest Neighbor Concept
• Modeling and Evaluation in Python
MODULE 1: FEATURE ENGINEERING
• Introduction to Feature Engineering
• Feature Engineering Techniques: Encoding, Scaling, Data Transformation
• Handling Missing values, handling outliers
• Creation of Pipeline
• Use case for feature engineering
MODULE 2: ML ALGO: SUPPORT VECTOR MACHINE (SVM)
• Introduction to SVM
• How It Works: SVM Concept, Kernel Trick
• Modeling and Evaluation of SVM in Python
MODULE 3: PRINCIPAL COMPONENT ANALYSIS (PCA)
• Building Blocks Of PCA
• How it works: Finding Principal Components
• Modeling PCA in Python
MODULE 4: ML ALGO: DECISION TREE
• Introduction to Decision Tree & Random Forest
• How it works
• Modeling and Evaluation in Python
MODULE 5: ENSEMBLE TECHNIQUES - BAGGING
• Introduction to Ensemble technique
• Bagging and How it works
• Modeling and Evaluation in Python
MODULE 6: ML ALGO: NAÏVE BAYES
• Introduction to Naive Bayes
• How it works: Bayes' Theorem
• Naive Bayes For Text Classification
• Modeling and Evaluation in Python
MODULE 7: GRADIENT BOOSTING, XGBOOST
• Introduction to Boosting and XGBoost
• How it works?
• Modeling and Evaluation of in Python
MODULE 1: TIME SERIES FORECASTING - ARIMA
• What is Time Series?
• Trend, Seasonality, cyclical and random
• Stationarity of Time Series
• Autoregressive Model (AR)
• Moving Average Model (MA)
• ARIMA Model
• Autocorrelation and AIC
• Time Series Analysis in Python
MODULE 2: SENTIMENT ANALYSIS
• Introduction to Sentiment Analysis
• NLTK Package
• Case study: Sentiment Analysis on Movie Reviews
MODULE 3: REGULAR EXPRESSIONS WITH PYTHON
• Regex Introduction
• Regex codes
• Text extraction with Python Regex
MODULE 4: ML MODEL DEPLOYMENT WITH FLASK
• Introduction to Flask
• URL and App routing
• Flask application – ML Model deployment
MODULE 5: ADVANCED DATA ANALYSIS WITH MS EXCEL
• MS Excel core Functions
• Advanced Functions (VLOOKUP, INDIRECT..)
• Linear Regression with EXCEL
• Data Table
• Goal Seek Analysis
• Pivot Table
• Solving Data Equation with EXCEL
MODULE 6: AWS CLOUD FOR DATA SCIENCE
• Introduction of cloud
• Difference between GCC, Azure, AWS
• AWS Service ( EC2 instance)
MODULE 7: AZURE FOR DATA SCIENCE
• Introduction to AZURE ML studio
• Data Pipeline
• ML modeling with Azure
MODULE 8: INTRODUCTION TO DEEP LEARNING
• Introduction to Artificial Neural Network, Architecture
• Artificial Neural Network in Python
• Introduction to Convolutional Neural Network, Architecture
• Convolutional Neural Network in Python
MODULE 1: DATABASE INTRODUCTION
• DATABASE Overview
• Key concepts of database management
• Relational Database Management System
• CRUD operations
MODULE 2: SQL BASICS
• Introduction to Databases
• Introduction to SQL
• SQL Commands
• MY SQL workbench installation
MODULE 3: DATA TYPES AND CONSTRAINTS
• Numeric, Character, date time data type
• Primary key, Foreign key, Not null
• Unique, Check, default, Auto increment
MODULE 4: DATABASES AND TABLES (MySQL)
• Create database
• Delete database
• Show and use databases
• Create table, Rename table
• Delete table, Delete table records
• Create new table from existing data types
• Insert into, Update records
• Alter table
MODULE 5: SQL JOINS
• Inner Join, Outer Join
• Left Join, Right Join
• Self Join, Cross join
• Windows function: Over, Partition, Rank
MODULE 6: SQL COMMANDS AND CLAUSES
• Select, Select distinct
• Aliases, Where clause
• Relational operators, Logical
• Between, Order by, In
• Like, Limit, null/not null, group by
• Having, Sub queries
MODULE 7 : DOCUMENT DB/NO-SQL DB
• Introduction of Document DB
• Document DB vs SQL DB
• Popular Document DBs
• MongoDB basics
• Data format and Key methods
MODULE 1: GIT INTRODUCTION
• Purpose of Version Control
• Popular Version control tools
• Git Distribution Version Control
• Terminologies
• Git Workflow
• Git Architecture
MODULE 2: GIT REPOSITORY and GitHub
• Git Repo Introduction
• Create New Repo with Init command
• Git Essentials: Copy & User Setup
• Mastering Git and GitHub
MODULE 3: COMMITS, PULL, FETCH AND PUSH
• Code Commits
• Pull, Fetch and Conflicts resolution
• Pushing to Remote Repo
MODULE 4: TAGGING, BRANCHING AND MERGING
• Organize code with branches
• Checkout branch
• Merge branches
• Editing Commits
• Commit command Amend flag
• Git reset and revert
MODULE 5: GIT WITH GITHUB AND BITBUCKET
• Creating GitHub Account
• Local and Remote Repo
• Collaborating with other developers
MODULE 1: BIG DATA INTRODUCTION
• Big Data Overview
• Five Vs of Big Data
• What is Big Data and Hadoop
• Introduction to Hadoop
• Components of Hadoop Ecosystem
• Big Data Analytics Introduction
MODULE 2 : HDFS AND MAP REDUCE
• HDFS – Big Data Storage
• Distributed Processing with Map Reduce
• Mapping and reducing stages concepts
• Key Terms: Output Format, Partitioners,
• Combiners, Shuffle, and Sort
MODULE 3: PYSPARK FOUNDATION
• PySpark Introduction
• Spark Configuration
• Resilient distributed datasets (RDD)
• Working with RDDs in PySpark
• Aggregating Data with Pair RDDs
MODULE 4: SPARK SQL and HADOOP HIVE
• Introducing Spark SQL
• Spark SQL vs Hadoop Hive
MODULE 1: TABLEAU FUNDAMENTALS
• Introduction to Business Intelligence & Introduction to Tableau
• Interface Tour, Data visualization: Pie chart, Column chart, Bar chart.
• Bar chart, Tree Map, Line Chart
• Area chart, Combination Charts, Map
• Dashboards creation, Quick Filters
• Create Table Calculations
• Create Calculated Fields
• Create Custom Hierarchies
MODULE 2: POWER-BI BASICS
• Power BI Introduction
• Basics Visualizations
• Dashboard Creation
• Basic Data Cleaning
• Basic DAX FUNCTION
MODULE 3 : DATA TRANSFORMATION TECHNIQUES
• Exploring Query Editor
• Data Cleansing and Manipulation:
• Creating Our Initial Project File
• Connecting to Our Data Source
• Editing Rows
• Changing Data Types
• Replacing Values
MODULE 4: CONNECTING TO VARIOUS DATA SOURCES
• Connecting to a CSV File
• Connecting to a Webpage
• Extracting Characters
• Splitting and Merging Columns
• Creating Conditional Columns
• Creating Columns from Examples
• Create Data Model
AI is the future, and DataMites helped me step into it! The online Data Science course was easy to follow, and the tutors explained everything clearly. Even after completing my course, the team supported me with placements and I successfully cracked a job! Grateful to DataMites for shaping my career.
I joined DataMites to learn Data Science and gained strong skills in ML, DL, and Statistics. Through my internship at Rubixe AI Solutions, I worked on real-world projects, which helped me land job interviews and an offer. The trainers were very supportive and explained every concept clearly. Thanks to DataMites, my data science journey was smooth and successful.
My mentor, a DataMites alumnus, suggested I join the Data Science course, and it was one of my best decisions! The offline classes were interactive and full of guidance, and I got the chance to intern at Rubixe AI Solutions. The placement team was very supportive and helped me perfect my resume. Truly thankful to DataMites for this amazing learning journey.
I joined DataMites after completing my engineering in Computer Science and became a Certified Data Scientist. With their support, I completed an internship at Rubix AI Solutions and now work as an AI intern at Inventor Hub. DataMites made learning statistics and data science easy with clear guidance and great materials. I’m truly thankful for their support.
I joined DataMites for the Certified Data Scientist online course, and it was a great experience! The real-time projects helped me apply my learning practically, and the placement support added real value to my career restart after 8 years. DataMites is the perfect platform to learn, grow, and begin your data science journey.
I joined DataMites for the Data Science course and learned Python, SQL, Machine Learning, and Deep Learning through hands-on projects. The trainers are excellent at explaining concepts clearly. The placement team is very supportive and provides great opportunities thanks to DataMites for helping me start my data science journey.
I joined DataMites after my B.Tech when I developed an interest in Data Science and Machine Learning. The training was well-structured, and I even got an internship opportunity that helped me gain real experience. The placement team was super supportive and guided me through every step. Thanks to DataMites, I’m now placed at Horizon Broadband Pvt. Ltd.
I joined DataMites after completing my BCA, and it was the best decision for my data science career! I learned Python, SQL, Machine Learning, Deep Learning, and NLP, and worked on several capstone and client projects that gave me real-world experience. The trainers and team were always friendly and supportive, patiently clearing all my doubts. Thanks to DataMites, I’m confident and job-ready in data science
I started my data science journey with DataMites, and it’s been an amazing experience! The Certified Data Scientist Program helped me learn everything from scratch through hands-on projects and an internship. The placement team was incredibly supportive, always ready to clarify my doubts. Thanks to their guidance, I successfully got placed. Highly recommend DataMites to anyone starting their data science career
Enrolling at DataMites was one of the best decisions I made for my career. Coming from a freelance writing background with no prior technical experience, I was initially unsure about stepping into the field of data analytics. But DataMites made the transition smooth and achievable. I’d highly recommend them to anyone looking for a guided, industry-ready data analytics course. A true DataMites success story!
Data Science combines statistics, programming, machine learning, and data analysis to extract useful insights from data. In Edmonton, it supports decision-making across technology, finance, healthcare, government, energy, and professional services.
Start with programming, statistics, SQL, data analysis, and machine learning, followed by practical projects using real datasets. A Data Science course, industry-focused training, and a recognized certification can help build the skills needed for a Data Scientist career.
Edmonton has opportunities across data, analytics, machine learning, and related technology roles. Job Bank identifies Edmonton as one of the main employment centres for Data Scientists in Alberta.
Data Scientist
Machine Learning Engineer
Data Analyst
Business Intelligence Analyst
AI/ML Engineer
Data Engineer
The duration of a Data Science course in Edmonton varies by curriculum and learning format. Professional programs can range from a few months to a year or more, while intensive programs may be completed in several weeks.
The Data Science course fee in Edmonton generally ranges from CAD 1,000 to CAD 5,000 for professional online or instructor-led training, depending on course duration, curriculum, projects, and certification. Fees for university or college programs are not included in this range.
Most Data Science courses require basic mathematics, logical reasoning, computer skills, and a willingness to learn programming. Advanced programming experience is not always necessary for beginner-level training, although basic Python knowledge can be helpful.
The average Data Scientist salary in Edmonton is approximately C$98,322 per year, according to Glassdoor's July 2026 data; Indeed reports an average base salary of about C$81,720. Actual salary varies by experience, skills, employer, and role.
Yes, Data Science has a growing presence in Edmonton, particularly across technology, professional services, finance, healthcare, and public administration. Canada's Job Bank rates the Edmonton-region outlook as Moderate for 2025–2027.
Data Science can be a strong career choice for people interested in statistics, programming, and analytical problem-solving. Edmonton offers opportunities across several industries, with Job Bank identifying approximately 1,850 Data Scientists working in the region
Yes, you can learn Data Science through an online course from Edmonton. Online training can cover Python, SQL, statistics, machine learning, data visualization, and practical projects while offering flexible study options.
Key skills include Python, SQL, statistics, probability, machine learning, data visualization, data cleaning, and problem-solving. Communication and the ability to explain analytical findings clearly are also important for a successful Data Science career.
Begin by learning Python, SQL, statistics, and data analysis, then progress to machine learning and visualization. Build practical projects, develop a portfolio, complete relevant training or certification, and apply for entry-level data and analytics roles.
Yes, professionals from business, finance, healthcare, engineering, and other fields can transition into Data Science with structured training. Starting with statistics, Python, SQL, and data analysis can provide a practical foundation for a career change.
Data Science professionals work across professional and technical services, finance and insurance, public administration, information services, and healthcare. Job Bank reports these among the leading sectors employing Data Scientists in the Edmonton region.
Yes, statistics is an important part of Data Science because it helps with data interpretation, probability, hypothesis testing, experimentation, and model evaluation. A Data Science course that includes statistics can provide a stronger foundation for machine learning and analytics.
Common Data Science tools include Python, SQL, Jupyter Notebook, NumPy, Pandas, Scikit-learn, TensorFlow, PyTorch, Tableau, and Power BI. Cloud platforms and database technologies are also increasingly useful in professional Data Science roles.
Data Analytics focuses mainly on examining data to identify trends and support decisions, while Data Science covers a broader process including statistics, programming, and predictive modelling. Machine Learning is a specialized area used to develop models that learn patterns from data.
Data Science uses mathematics and statistics, but it is not purely a mathematics job. Practical Data Science also requires programming, data handling, machine learning, visualization, and business or domain knowledge.
DataMites offers a structured Data Science Course in Edmonton with practical learning, real-time projects, hands-on training, and industry-relevant tools. Learners can choose Live Online or Blended Learning based on their preferences.
DataMites courses are delivered by experienced industry professionals with expertise in Data Science and related technologies. The training focuses on practical concepts, hands-on learning, and real-world applications.
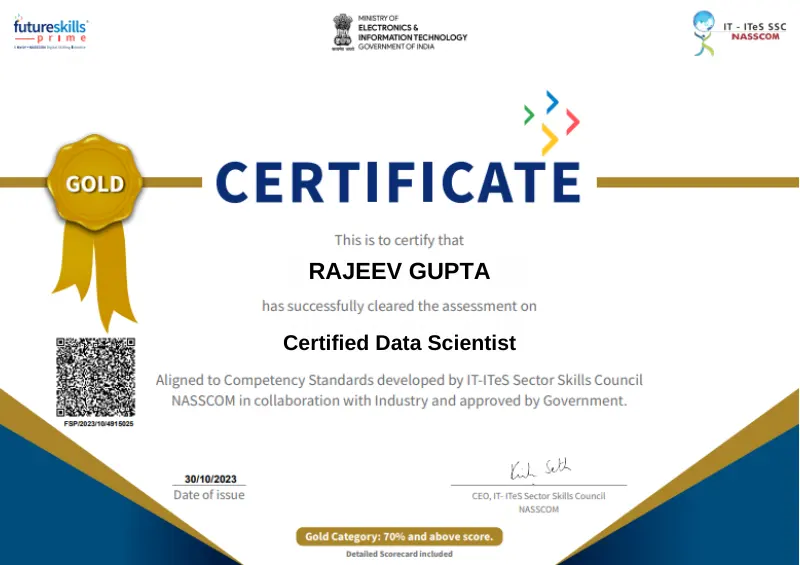
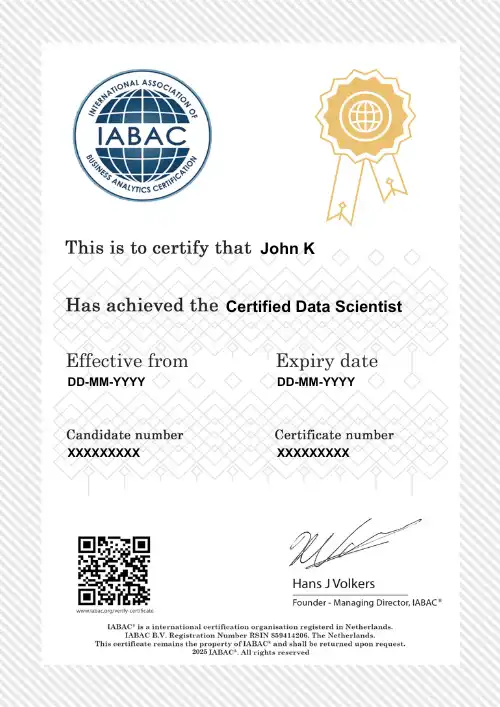
Learners can pursue an IABAC Globally Accredited Certification and a DataMites Certificate. Eligible NRI learners can also receive NASSCOM FutureSkills Certification, subject to applicable requirements.
The DataMites Certified Data Scientist Course has a duration of 8 months, with approximately 700 learning hours. The program combines structured learning with practical training and projects.
Refund eligibility depends on the cancellation timing and applicable terms in the official DataMites Refund Policy. Learners should review the policy before cancellation, as refund conditions vary by situation.
Yes. Fresh graduates can enroll in the Data Science Course in Edmonton, provided they meet the course requirements. The curriculum is structured to help learners build foundational and advanced Data Science skills.
The Data Science Course Fee in Edmonton is C$ 3,050 for Live Virtual (Instructor-Led Live Online) and C$ 2,130 for Blended Learning (Self Learning + Live Mentoring).
You can enroll in the Online Data Science Course in Edmonton by selecting your preferred learning mode, completing the registration process, and making the applicable payment. Enrollment confirmation and course access details are provided after registration.
DataMites provides access to online study materials for 6 months up to 1 year, depending on the course and learning arrangement.
DataMites offers Live Online and Blended Learning (Self Learning + Live Mentoring) options. Both modes are designed to provide structured learning with practical exposure.
Yes. The Data Science Training in Edmonton includes opportunities to work on real-time projects under expert guidance. This helps learners apply concepts to practical data science scenarios.
DataMites supports online payment options and overseas payment options, including commonly accepted card and PayPal payments. Available payment methods may vary depending on the learner's location and enrollment arrangement.
The Flexi Pass allows learners to attend sessions of their selected course for revision and doubt clarification for a specified period. The current DataMites information describes a 3-month Flexi Pass for such learning needs.
Installment availability can depend on the payment method and enrollment arrangement. DataMites supports online payments, and eligible credit-card transactions may offer EMI facilities where available.
If you miss a Live Online session, DataMites provides recorded sessions that can be accessed later. This allows learners to review the missed content at their convenience.
Yes. DataMites offers internship opportunities where learners can gain practical exposure under industry guidance. Successful completion of the internship can also include an internship and experience certificate.
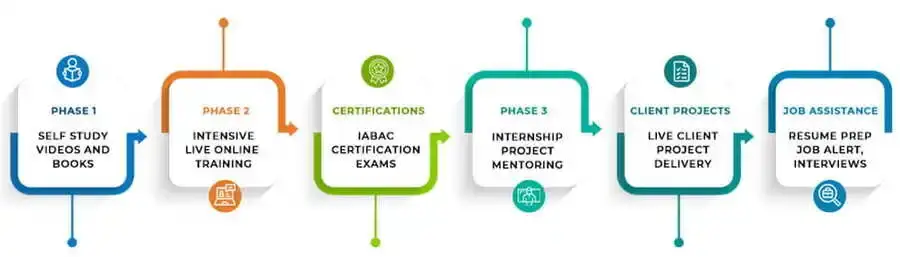
The DataMites Placement Assistance Team(PAT) facilitates the aspirants in taking all the necessary steps in starting their career in Data Science. Some of the services provided by PAT are: -
The DataMites Placement Assistance Team(PAT) conducts sessions on career mentoring for the aspirants with a view of helping them realize the purpose they have to serve when they step into the corporate world. The students are guided by industry experts about the various possibilities in the Data Science career, this will help the aspirants to draw a clear picture of the career options available. Also, they will be made knowledgeable about the various obstacles they are likely to face as a fresher in the field, and how they can tackle.
No, PAT does not promise a job, but it helps the aspirants to build the required potential needed in landing a career. The aspirants can capitalize on the acquired skills, in the long run, to a successful career in Data Science.
 Refer & Earn
 +1-628-228-6062